
Water · Installation and calibration
How long does biofouling take to spoil a conductivity record? What a study with moored sensors in the Baltic measured
In a study off the southern Baltic coast, a conductivity sensor moored at 2 m with a used TBT cell was out of specification at the first comparison after deployment, on day 32; with a UVC emitter, the last references, after 237 days, were within the margin. What this changes when planning visits and references.
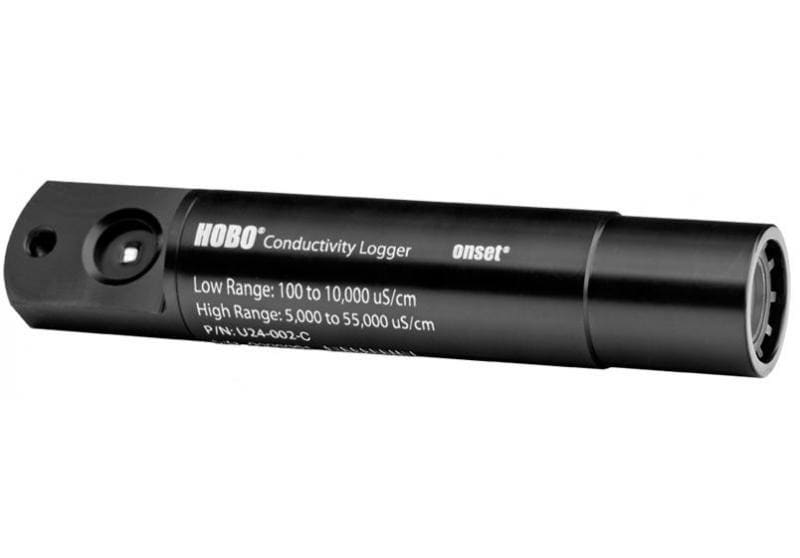
Anyone who leaves a conductivity or salinity logger in a bay, a harbour, a coastal lagoon or an aquaculture site may read the accuracy on the datasheet as if it were the accuracy of the whole record. Once in the water, however, the sensor is exposed to organisms and sediment: the US Geological Survey (USGS) guidelines for continuous monitors describe specific conductance sensors as reliable, accurate and durable, but susceptible to that fouling. A study published in July 2025 in Frontiers in Marine Science measured how much biofouling weighed on moored sensors off the southern Baltic coast. It is not a general rule: it is what happened in this study, and it helps decide how often to visit the site and what reference to check it against.
The study question
Robert Mars, Bennet Krebs, Mathis Bjoerner, Marialena Christopoulou and Oliver Zielinski, from the Leibniz Institute for Baltic Sea Research (Warnemünde, Germany) and Sea-Bird Scientific, wanted to know whether an ultraviolet C (UVC) emitter of their own design, with about twenty times the energy efficiency of previous commercial designs, keeps moored sensors clean and, with that, keeps their readings within the manufacturer's specification. To find out, they compared deployments with and without the emitter in the same area.
How it was done
- Site: southern Baltic coast; most of the tests took place at the Arkona Basin station, with the conductivity sensors moored at 2 m depth.
- Conductivity without the emitter: a moored CTD (SBE37) logged for 155 days in 2018 with a used tributyltin (TBT) cell and copper tubes, and no UVC emitter.
- Conductivity with the emitter: a second deployment of the same model logged for 237 days in 2021 with the UVC emitter and no TBT cell. Both deployments started in July: the first reference is from 18/19 July 2018 and from 14/15 July 2021.
- Reference: profiles with a shipboard CTD (SBE 911plus) about 150 m from the mooring, on the day of deployment and on later dates: days 32, 96/98 and 155 in 2018; days 94/95 and 237 in 2021.
- Allowed margin: the authors compare each deviation with the instrument's accuracy (±0.003 mS/cm) plus its stated stability (0.003 mS/cm per month), so the margin grows with time in the water.
The study also tested chlorophyll fluorometers, for which the manufacturer states no accuracy; this article focuses on conductivity.
What was observed
Without the emitter (2018). At the first comparison after deployment, on day 32, the mean deviation was -0.0129 mS/cm against a margin of ±0.006 mS/cm: twice the margin. By day 96/98 it had reached -1.0699 mS/cm against ±0.012 mS/cm, 89 times the margin, and then stayed almost constant for the following two months. The root mean square error (RMSE) against the reference was 0.9998 mS/cm on day 155. The authors put it this way: "None of the comparison measurements after the day of deployment are inside the specified sensor accuracy". They attribute the problem to biofouling in late summer and autumn on the Baltic coast: macro-fouling (barnacles, algae or mussels) changes the geometry of the conductivity cell, and the conductivity data indicate no further growth between mid-October and mid-December.
With the emitter (2021). The last two references, after 237 days, gave a mean deviation of -0.0099 mS/cm, "well within the expected accuracy", and the RMSE (0.0098 mS/cm) was two orders of magnitude lower than in 2018. Not everything stayed inside: on day 94/95 the mean was outside the expected accuracy by 45%; the first two reference samples only came within it when the authors matched them with the mooring record taken 10 minutes earlier, and the third stayed outside.
Other observations. On a fluorometer with a mechanical wiper, a barnacle grew on the rubber lid of the wiper. With the emitter, mussels appeared on non-illuminated areas of its housing in two of roughly 100 deployments.
Limits of transfer
- One campaign per configuration. The article reports a single deployment of each CTD version, in different years (2018 and 2021), so the difference between them does not come from a replicated trial.
- Water and season. These are coastal waters of the southern Baltic, at 2 m, with deployments that started in July. In a Mediterranean lagoon, an Atlantic estuary or an Iberian harbour, with a different temperature, salinity and set of organisms, the fouling rate may differ, and this study does not measure it.
- Equipment. The values in mS/cm refer to a CTD whose conductivity cell changes geometry as it fouls; a sensor based on another technology may behave differently, and the study does not test it.
- Imperfect reference. The ship was 150 m from the mooring and mixes the water near the surface, and the authors note that it is impossible to sample exactly the same water.
- The emitter. It is the authors' own design, which the article does not present as a commercial product, and it does not cover instruments with pumped flow paths. One of the authors is affiliated with Sea-Bird Scientific, maker of the CTDs used; the article declares no conflict of interest.
What this changes in a measurement decision
- Do not read the datasheet as the error of the record. In this study, with a used TBT cell and no emitter, conductivity was out of specification at the first visit after deployment, on day 32.
- Schedule references during the deployment, not only at the start and the end. In 2018 the error multiplied between day 32 and day 96/98 and then stayed almost constant; with two comparisons, one at deployment and one at recovery, the final error would have been visible, but not when it appeared.
- Read before and after cleaning. The USGS guidelines define the fouling error as the difference between the initial sensor reading and the cleaned-sensor reading, and the calibration drift as the difference between the cleaned-sensor reading in calibration standard solutions and the expected value. Recording both lets you tell one from the other.
- Match the visit frequency to the water and the season. The same guidelines state that maintenance frequency is generally governed by the fouling rate, and that temperature and specific conductance sensors tend to be less affected by fouling than dissolved oxygen, pH and turbidity sensors. Even so, in the 2018 deployment (July to December), fouling occurred in late summer and autumn.
- Record the exact time and depth of every reference. In 2021, two of the three day 94/95 samples only came within the margin when matched with the record taken 10 minutes earlier.
- Choose the protection knowing its limits. A TBT cell is toxic, a mechanical wiper can end up colonised by barnacles, and a UVC emitter leaves unprotected the areas it does not light.
References
- Mars, R., Krebs, B., Bjoerner, M., Christopoulou, M. and Zielinski, O. (2025). Optimized UVC-based antifouling system for moored applications. Frontiers in Marine Science, 12, 1625587. DOI: 10.3389/fmars.2025.1625587. Full text (accessed 4 November 2026).
- Wagner, R. J., Boulger, R. W., Jr., Oblinger, C. J. and Smith, B. A. (2006). Guidelines and Standard Procedures for Continuous Water-Quality Monitors: Station Operation, Record Computation, and Data Reporting. U.S. Geological Survey, Techniques and Methods 1-D3. Publication (accessed 4 November 2026).
Commercial selection by EIC Controls
The HOBO U24-002-C logger measures conductivity and temperature in salt water, from 100 to 55,000 µS/cm in two ranges, and the HOBOware Pro software converts the data to specific conductance and salinity (PSS-78). Its datasheet states sensor drift of up to 12% per month, excluding drift from fouling, and calls for monthly start- and end-point calibration with the Conductivity Assistant to achieve the specified accuracy; the non-contact sensor is easy to reach for cleaning. Still to be sized: the range to configure, the reference instrument for those calibrations, the mounting at the site and the offload method (USB optical interface or compatible HOBO Waterproof Shuttle).
Instruments for this application
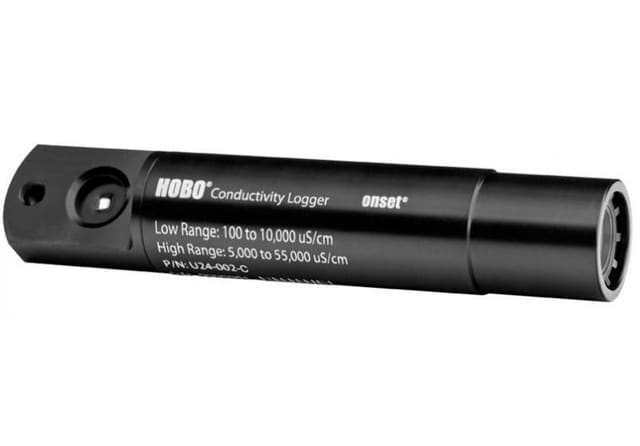
LI-COR (HOBO, InTemp, LI-COR) · U24-002-C
HOBO Salt Water Conductivity/Salinity Data Logger
The HOBO U24-002-C is a cost-effective data logger for measuring salinity, conductivity and temperature in saltwater environments with relatively small changes in salinity (±5,000 μS/cm) such as saltwater bays, or to detect salinity events such as upwelling,…
Keep reading
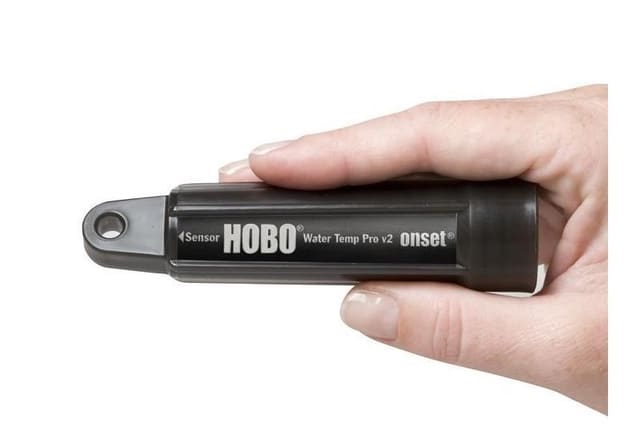
Water temperature in a river: how to stop your logger measuring the sun, still water or the air
Five decisions for installing a water temperature logger in a river: compare the sensors, look for shade, look for moving water, plan for the level dropping and choose the interval. With the limits of each source.
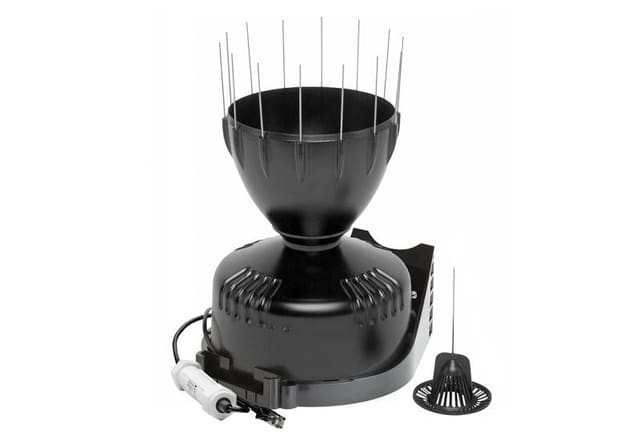
When it rains hardest, it misses most: height, calibration and maintenance of tipping-bucket rain gauges
A tipping-bucket rain gauge loses rain to wind and to its own mechanics, and the second loss grows with intensity. What four peer-reviewed studies say about installation height, dynamic calibration and maintenance.
Field calibration or laboratory curve: what one study measured with soil moisture sensors
A study published in May 2026 calibrated low-cost capacitive sensors in the laboratory and then moved them to real plots. The laboratory curve drifted in the field, and a single reference measurement on site recovered much of the accuracy.