
Water · Installation and calibration
Water temperature in a river: how to stop your logger measuring the sun, still water or the air
Five decisions for installing a water temperature logger in a river: compare the sensors, look for shade, look for moving water, plan for the level dropping and choose the interval. With the limits of each source.
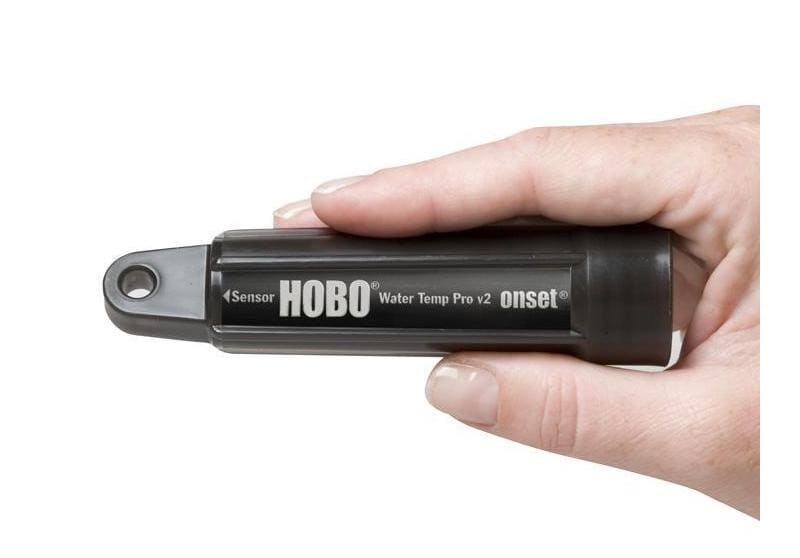
A water temperature logger fixed in a river stores a value every hour for months, and nobody looks at it until the next visit. If the sun shines straight on it in a shallow pool, if it sits in still water, or if the level drops and leaves it in the air, it keeps storing data at the same resolution, but that data no longer describes the river. That is why they are best avoided beforehand: when choosing the site, preparing the sensors and planning the visits.
This guide sets out five decisions based on two peer-reviewed studies and the field guide from the United States Geological Survey (USGS). None of the three sources studied Iberian rivers: what transfers is the method, not the figures.
1. Compare the sensors with each other before installing them, and again when you collect them
When two sites in a network differ by a few tenths of a degree, the first question is whether the rivers differ or the sensors do. Johnson and Wilby (2013) compared exposed and shielded sensors in shallow still water under direct sunlight: the mean difference was 0.4 °C, and the authors attribute around 0.3 °C of it to variation in accuracy between sensors, not to radiation. They also found that radiative error was modest compared with the discrepancy between different manufacturers, and their first recommendation is to install the same sensor type throughout the network.
The USGS guide (Heck and others, 2018) makes this check routine: a calibration check before and after each field installation, with the loggers spending 30 minutes in a warm bath, 30 minutes in a cool-down bath and 30 minutes in a cold bath, alongside a calibrated reference logger of the same model. Inaccurate loggers are sent back to the manufacturer. Sowder and Steel (2012) suggest a minimal version: leave all the loggers in a common environment for a short period before deployment, repeat it after recovery, and give them all the same settings (observations per day, standard time, units and time of the first observation).
Decision: one model across the whole network, all sensors together in the same bath before and after, and each sensor's offset written into the site record.
2. Shade first; a shield where direct sunlight cannot be avoided
In Johnson and Wilby's outdoor trial, with clear, still water 0.2 m deep under direct sunlight, the difference between exposed and shielded sensors reached 1.6 °C. According to their analysis, a difference above 0.5 °C requires direct, bright sunlight, above 400 W/m² in the total spectrum. The shield they used was a perforated white PVC tube, 70 mm in diameter and 0.3 m long, which lets water move freely around the sensor.
Their recommendations follow an order: site sensors in shade (near the bank, under riparian vegetation or in shade from the wider landscape) and, where exposure to direct sunlight is unavoidable, use high-albedo shields that let the water ventilate the sensor. According to the authors, their evidence suggests a shield is only absolutely necessary when the sensor sits in bright, direct sunlight. The USGS guide, for its part, lists one PVC solar shield per logger in its installation kit.
An important limit: the authors themselves present their figures as an extreme case compared with natural water bodies, where they expect much smaller errors, because deeper water and suspended material reduce the light reaching the sensor. The 1.6 °C is not a correction to apply to another river; it is the reason not to leave a sensor in the sun in a shallow pool.
3. Moving water, not still water
In the laboratory, under artificial light, the same authors measured radiative errors an order of magnitude smaller with the sensor in flowing water, even at 0.1 m/s, because moving water carries the heat away (advection). Their recommendation is to place sensors in comparable channel units, such as riffles or chutes, in flowing water, and to avoid dead zones or stagnant water unless the thermal heterogeneity itself is what is being studied.
The USGS guide reaches the same point by another route: stagnant water warms and cools more readily and may not represent conditions in the stream. It asks for the logger to be anchored, where possible, where the water is moving, and not too close to a tributary junction or a groundwater seep, as those spots may not be representative either. It also suggests anchoring it in or near the thalweg (the deepest part of the cross-section), so that it stays wet for as long as the channel holds water.
4. Plan for the level dropping: the logger may end up in the air or buried
Sowder and Steel (2012), working with records from the Sauk River in north-western Washington State, list the reasons a logger comes out of the water: storms, droughts, anchoring failures, malfunction or public interference. Floods, they add, can bury loggers in silt. In both cases the logger keeps storing data, and the fault only shows up if someone looks for it.
The signal they propose is air temperature. In temperate regions in summer the air is often much warmer than the stream, and in every season water temperature generally varies less from one day to the next than air temperature. A close correspondence between water and air temperature is, according to the authors, a strong indication that the logger was out of the water. That is why they recommend installing an air temperature logger out of direct sunlight in the same area and, in highly variable channels, redundant loggers in the same channel, to raise the chance of always having at least one underwater.
At every visit it is worth recording the date and time of installation and recovery, and whether the logger was found in the air or buried: for the authors, those notes are the first indication of errors in the data. The USGS guide asks for a record, at installation, of whether the sensor is completely submerged, submerged but close to the surface, exposed to air but close to the surface, or completely dry. In the analysis, Sowder and Steel plot each record against air temperature, other sites, other years and, where available, flow.
5. Interval: one hour for the river, seconds for the bath
The USGS guide recommends a one-hour logging interval for field installations and 10 seconds for calibration checks. It justifies the hour with a result from Dunham and others (2005): a one-hour interval has a low probability of missing the daily maximum by more than 1 °C. If the question calls for following rapid changes, the interval should start from that question rather than from this rule.
Checklist before installing
- One sensor model across the network, with the same settings on every unit.
- A common-bath test before going out and at recovery, with each sensor's offset recorded.
- A shaded site, in moving water, in or near the thalweg, away from tributaries and seeps.
- A white, perforated shield where direct sunlight cannot be avoided.
- An air logger out of direct sunlight in the same area, plus redundancy if the channel is highly variable.
- Date and time of installation and recovery, and the sensor's condition at installation and at recovery.
- A one-hour interval, unless the question calls for another.
Limits
Johnson and Wilby's results come from still water 0.2 m deep and from the laboratory, with two sensor models. The USGS guide was written for streams in the United States, and its one-hour criterion refers to the daily maximum within a 1 °C margin. Sowder and Steel illustrate their method with a single river and acknowledge that, despite careful protocols, data cleaning is inherently subjective. None of the sources studied rivers on the Iberian Peninsula: they help decide how to install and review, not how far a particular sensor is off.
References
- Johnson, M. F., and Wilby, R. L. (2013). Shield or not to Shield: Effects of Solar Radiation on Water Temperature Sensor Accuracy. Water, 5(4), 1622-1637. DOI: 10.3390/w5041622. Full text. Accessed 28 September 2026.
- Sowder, C., and Steel, E. A. (2012). A Note on the Collection and Cleaning of Water Temperature Data. Water, 4(3), 597-606. DOI: 10.3390/w4030597. Full text. Accessed 28 September 2026.
- Heck, M. P., Schultz, L. D., Hockman-Wert, D., Dinger, E. C., and Dunham, J. B. (2018). Monitoring stream temperatures: A guide for non-specialists. U.S. Geological Survey, Techniques and Methods, book 3, chapter A25. DOI: 10.3133/tm3A25. PDF. Accessed 28 September 2026.
Commercial selection by EIC Controls
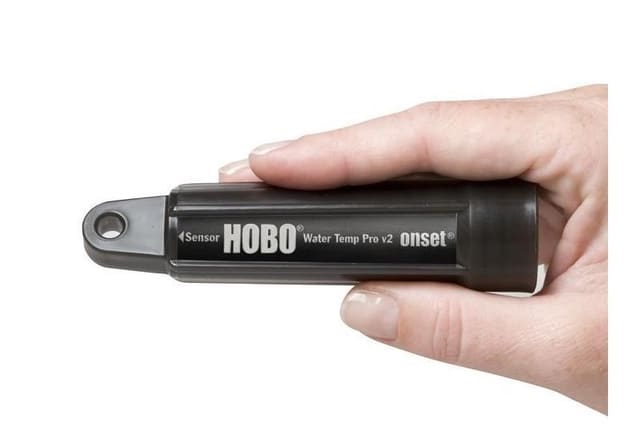
The HOBO Water Temperature Pro v2 data logger (U22-001) measures water temperature with an accuracy of ±0.21 °C from 0 to 50 °C and a resolution of 0.02 °C at 25 °C; its datasheet also gives a drift of 0.1 °C per year and a response time (90 %) of 5 minutes in water. In a network, using the same model at every site makes the common-bath test described above simpler, and the datasheet states that it also logs in air (from -40 to 70 °C), so it can serve as the air reference when installed out of direct sunlight. What still needs to be sized is the anchoring and the shade or shield at each site, the interval and visit frequency, and data offload through the optical USB interface with the software listed on the datasheet.
Instruments for this application
LI-COR (HOBO, InTemp, LI-COR) · U22-001
HOBO Water Temperature Pro v2 Data Logger (Waterproof to 120 m)
The HOBO Water Temp Pro v2 is durable with 12-bit resolution. Complete with a precision sensor for ±0.2°C accuracy, this logger measures temperatures between -40°C and 70°C in air and up to 50°C in water. Its waterproof, streamlined case allows for extended…
Keep reading
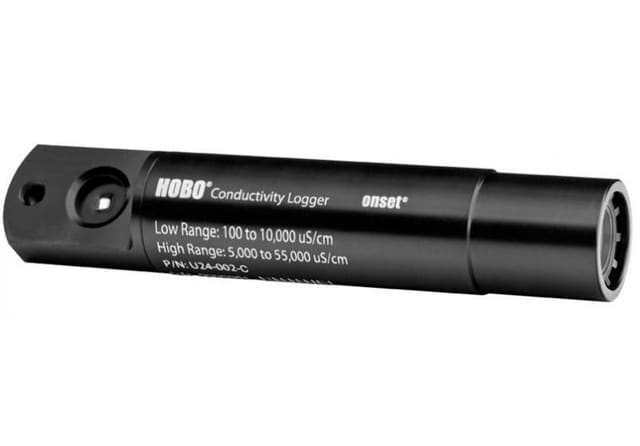
How long does biofouling take to spoil a conductivity record? What a study with moored sensors in the Baltic measured
In a study off the southern Baltic coast, a conductivity sensor moored at 2 m with a used TBT cell was out of specification at the first comparison after deployment, on day 32; with a UVC emitter, the last references, after 237 days, were within the margin. What this changes when planning visits and references.
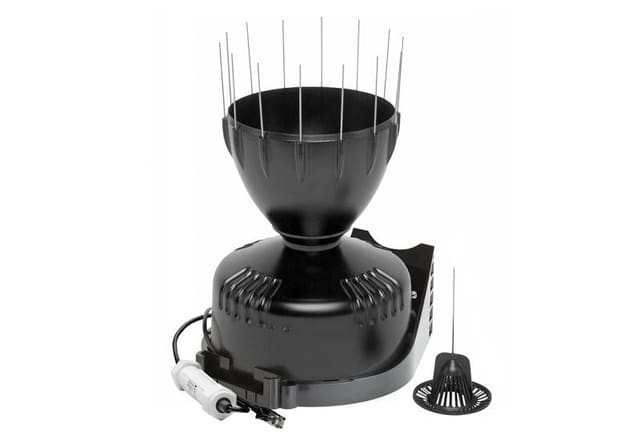
When it rains hardest, it misses most: height, calibration and maintenance of tipping-bucket rain gauges
A tipping-bucket rain gauge loses rain to wind and to its own mechanics, and the second loss grows with intensity. What four peer-reviewed studies say about installation height, dynamic calibration and maintenance.
Field calibration or laboratory curve: what one study measured with soil moisture sensors
A study published in May 2026 calibrated low-cost capacitive sensors in the laboratory and then moved them to real plots. The laboratory curve drifted in the field, and a single reference measurement on site recovered much of the accuracy.