
Data logging · Temperature and humidity
Monitoring the climate of a museum or church: how often to log, for how long and at how many points
One hour or less between readings, at least 13 months of data to apply the EN 15757 standard, and a first campaign with many points before deciding how many loggers to keep. These are the decisions supported by two studies in Valencia museums and a US National Park Service guide.
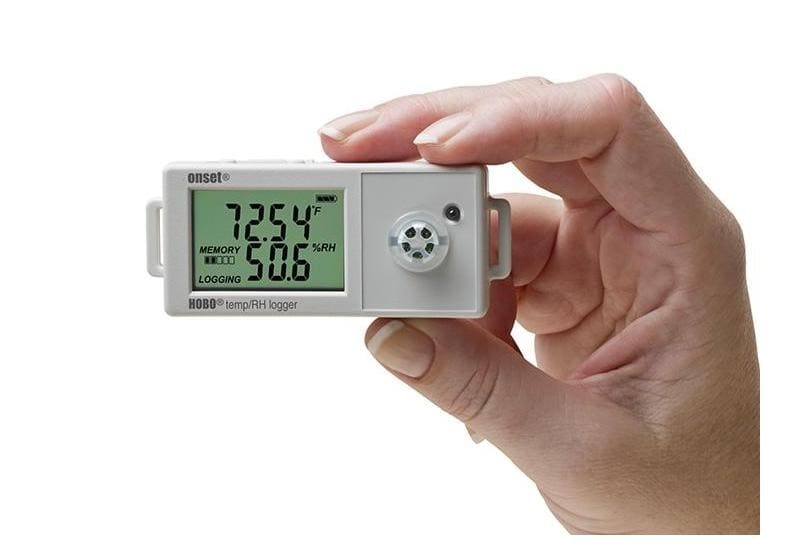
A data logger hung in a room of a museum, a church or an archive produces a temperature and relative humidity curve from day one. Whether that curve can be used to assess the risk to the collection depends on decisions made before it is installed: how often it logs, how long it stays and at how many points you measure. This guide sets out those decisions using two studies carried out in Valencia, one in the Sorolla Room of the Pio V Museum of Fine Arts and the other at the l'Almoina Archaeological Centre, together with a US National Park Service (NPS) guide on data loggers for museums.
1. Before installing, check the loggers side by side
At l'Almoina, an underground museum of about 2500 m² lying about 3 m below street level, the researchers installed 27 autonomous data loggers. Before spreading them out, they placed all of them together for six hours in a climatic chamber at 15, 23 and 30 °C and fitted a linear correction for each one. The manufacturer stated an accuracy of ±1 °C between 0 and 50 °C.
The NPS guide proposes an equivalent step for humidity: check the calibration with small chambers and saturated salt solutions before installing new units. It also notes that manufacturers recommend recalibration at intervals of between 6 months and 3 years, with most advising once a year.
2. Interval: one hour or less, and shorter where conditions change quickly
The authors of the Pio V study point out that the EN 15757:2010 standard states that sampling intervals should be one hour or less. They logged every minute with four temperature and relative humidity probes, two inside the microclimate frames of two paintings by Sorolla and two outside, and recalculated the results as if they had logged every 15 minutes, every 30 minutes and every hour.
In that climate-controlled room, hourly logging gave highly reliable results, and the percentage of values within the acceptable ranges of the Italian standard UNI 10829 did not depend on the logging frequency. The authors conclude that, in a climate-controlled interior, the best frequency was one hour. However, for the probes outside the frames, reducing the frequency may not be valid when the aim is to assess daily fluctuations. And in more variable environments, the differences between results could compromise the final evaluation.
Daily means are no substitute for hourly data either. In the 42-day test with EN 15757, carried out after the paintings had left the museum, the relative humidity index calculated from daily means deviated by approximately 10 % from the one obtained with minute data, and the bands lay closer to the moving average, because averaging smooths out the variations within the day. The authors caution, however, that the test was very short and that a longer period would probably give closer agreement; they regard daily means calculated from hourly data as a first approximation of compliance with the standards.
At the other extreme, the Pio V authors warn that logging every minute can be inadequate because of the memory it needs and how hard the resulting file is to handle. The NPS guide adds the cost in batteries: a logger reading every five seconds will not last as long as one reading every hour, and specifications are usually based on a moderate sampling rate of every 20 to 30 minutes.
The decision that follows: one hour at most in stable rooms, and a shorter interval at exposed points (outside a frame or display case, as at Pio V) if daily fluctuations matter. At l'Almoina the loggers recorded every 5 minutes, but to apply EN 15757 the authors reduced the series to hourly values (the median of each hour) and considered a higher frequency unnecessary.
3. Duration: at least 13 months, with downloads and batteries planned
According to the authors of the l'Almoina study, EN 15757:2010 requires at least 13 months of data, because it uses a central 30-day moving average that needs another 30 days to be calculated. That average gives the seasonal trend; the short-term fluctuation is the difference between the reading and the trend, and the limits are set at the 7th and 93rd percentiles of those fluctuations.
Just over a year of logging loses value if the series arrives with gaps. At l'Almoina the data were downloaded by hand every two months, and 9 % of the temperature values from the 27 loggers were missing, because batteries ran out or because of human error in handling the devices; two of them were missing half of their series, and the authors had to impute the missing values. The NPS guide asks that, for trend monitoring, the logger has enough battery life for one full year and that downloads take place before the memory fills up, so that there are no gaps.
4. How many points and where: many at first, then only those you need
L'Almoina has a skylight of about 250 m² over part of the ruins. The researchers placed some loggers near the edge of the skylight and others next to the walls, with a maximum height difference of about 1.5 m between them, and one more outside the museum, in a nearby building very close to a ventilation grille, to record the outdoor air.
When EN 15757:2010 was applied to each series, the results differed considerably from one point to another. A principal component analysis followed by clustering split the loggers into three zones, and most of the potentially harmful short-term fluctuations corresponded to the area below the skylight, especially in summer.
Hence the authors' recommendation: first carry out a preliminary analysis of the series, using principal component clustering or other multivariate methods, to identify groups of sensors; once they are identified, one option is to remove the redundant loggers or calculate an average series for each zone and apply the standard to it. The authors themselves acknowledge that the number of loggers installed might seem somewhat excessive.
At Pio V the inside of each microclimate frame was measured separately from the room.
5. Reading the series without stopping at the standard
According to the l'Almoina authors, applying EN 15757:2010 directly seems insufficient to detect hidden anomalies. In their case they proposed a common band for all points, the median of the individual bands (2.50 °C), and a three-level alert. That figure belongs to that museum and does not carry over to another building.
Checklist
- Check all the loggers together before installing them and record the correction for each one.
- Set an interval of one hour or less, and shorten it at exposed points if daily fluctuations matter.
- Do not assess with daily means alone.
- Plan for at least 13 months of data, batteries for the whole period and a download schedule that runs ahead of full memory.
- Start with more points than you intend to keep, including one outdoors, and decide how many to keep after analysing the series.
- Measure the inside of microclimate display cases or frames separately.
- Record the date of every sensor replacement (why it matters).
Limits
The two studies share an author, Fernando-Juan García-Diego of the Universitat Politècnica de València, and describe two specific cases: a climate-controlled room and an underground museum with air conditioning and a skylight. None of the sources studies a church or an archive. At l'Almoina only temperature was analysed. In the Pio V study, the 42-day test was carried out after the paintings had left the museum, and the year analysed in the room included an air-conditioning failure. The NPS guide dates from 2011, comes from the United States and deals with how to choose and use loggers, not where to place them. The standards are cited as the study authors describe them: this guide does not interpret them or set target values for temperature or humidity for any collection, which are a matter for each institution's preventive conservation.
References
- García-Diego, F.-J.; Verticchio, E.; Beltrán, P.; Siani, A. (2016). Assessment of the Minimum Sampling Frequency to Avoid Measurement Redundancy in Microclimate Field Surveys in Museum Buildings. Sensors, 16(8), 1291. DOI: 10.3390/s16081291. Full text. Accessed 2 November 2026.
- Díaz-Arellano, I.; Zarzo, M.; García-Diego, F.-J.; Perles, A. (2021). A Methodology for the Multi-Point Characterization of Short-Term Temperature Fluctuations in Complex Microclimates Based on the European Standard EN 15757:2010: Application to the Archaeological Museum of L'Almoina (Valencia, Spain). Sensors, 21(22), 7754. DOI: 10.3390/s21227754. Full text. Accessed 2 November 2026.
- Perkins Arenstein, R.; Alderson, S. (2011). Comparing Temperature and Relative Humidity Dataloggers for Museum Monitoring. Conserve O Gram 3/3, National Park Service. PDF. Accessed 2 November 2026.
Commercial selection by EIC Controls
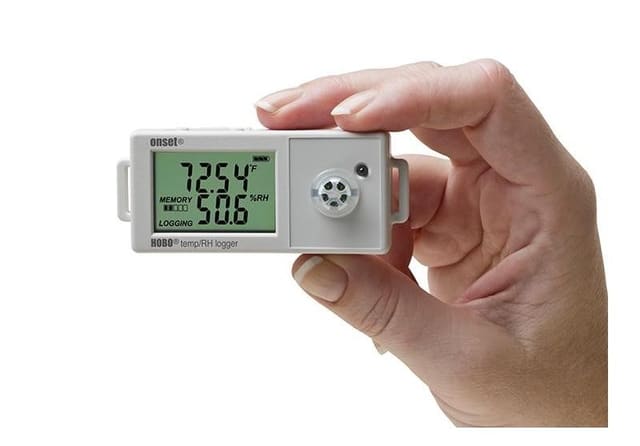
The HOBO UX100-011A data logger measures temperature and relative humidity indoors with built-in sensors: ±0.21 °C between 0 and 50 °C and ±2.5 % relative humidity between 10 % and 90 % (typical, to a maximum of ±3.5 % including hysteresis at 25 °C). It accepts logging intervals from 1 s to 18 h 12 min 15 s and its humidity sensor can be replaced by the user. What still needs sizing is how many units the initial campaign requires, where they go and how often they are downloaded over USB.
Instruments for this application
LI-COR (HOBO, InTemp, LI-COR) · UX100-011A
HOBO Temp/RH 2.5% Data Logger
The HOBO UX100-011 Temperature/Relative Humidity data logger records temperature and relative humidity (within 2.5% accuracy) in indoor environments with its integrated sensors. This data logger is ideal for monitoring occupant comfort in office buildings,…
Keep reading
Week in review, 26 to 30 October 2026: what to note down alongside the data
The week's four articles (the logger's clock, the vaccine refrigerator, the European climate resilience law and replacing a humidity sensor), three signals with their sources (the Commission's new tools, the WMO greenhouse gas bulletin and climate indicators for tourism in southern Catalonia) and what comes next: COP31 from 9 November.
Replacing a humidity sensor can leave a mark in the record: what a study of 55 UK stations found
A study of 55 UK stations detected changes in measurement technique in humidity records; at one station, smaller detections were linked to routine sensor replacements. What it allows you to conclude, what it does not, and what to log in your own record.
Is it really between 2 and 8 °C? Where to put the probe in a vaccine refrigerator and what to log
In a German study of 75 vaccine refrigerators, only 24 stayed between 2 and 8 °C over seven days of logging. How to decide where the probe goes, whether it sits in air or in a buffer, how often to log and who reviews the data, drawing on guidance from Madrid and the Basque Country.