
Data logging · Temperature and humidity
Replacing a humidity sensor can leave a mark in the record: what a study of 55 UK stations found
A study of 55 UK stations detected changes in measurement technique in humidity records; at one station, smaller detections were linked to routine sensor replacements. What it allows you to conclude, what it does not, and what to log in your own record.
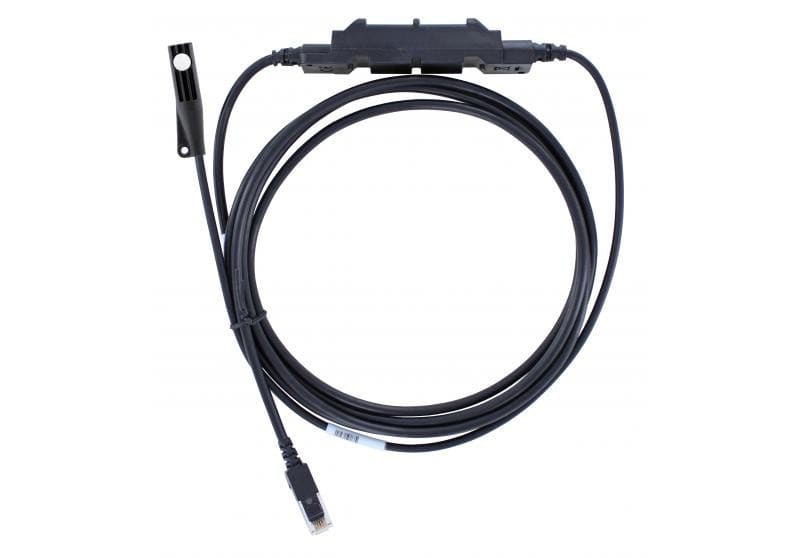
Anyone who keeps a relative humidity record for years, in a greenhouse, a warehouse, a museum or a weather station, ends up replacing the sensor: because it ages, because it fails or because it is due for replacement. The practical question is whether that change is written into the data and whether, without a maintenance log, you can tell afterwards when it happened. A study published in December 2025 by researchers at the UK's National Physical Laboratory (NPL) and the Met Office gives a partial answer, with limits worth knowing before you carry it over to your own measurement point.
The study's question
Valerie N. Livina, Kate Willett and Stephanie Bell asked whether a statistical technique designed to anticipate abrupt transitions in natural systems, tipping point analysis, can detect instrument changes in humidity records, including those that were never documented. They start from a fact recalled in their abstract: hygrometer technologies have changed over the years and, in some cases, have been prone to drift from ageing, condensation or contamination in service. In the introduction they give the move from psychrometer to electronic hygrometer as an example of a change in technology. The authors present the work as the first application of the technique for this purpose.
How it was done
The study analyses dew point and relative humidity at 55 UK observing stations, using data from HadISD, an hourly land surface dataset that spans several decades at these stations. The authors started with 56 stations, removed the data before the largest gap in each record, and one station was left too short. The relative humidity analysed is not a direct reading: it is derived from the HadISD dew point and temperature, with a climatological surface pressure taken from the ECMWF ERA5 reanalysis.
The method looks at the texture of the record rather than its mean value. After removing the global trend and seasonality, it computes, in sliding windows of 10 % of the record length, the lag-1 autocorrelation (how much, on average, each value depends on the previous one), the study's main indicator. It then locates changes with a Bayesian change point detection method and only counts as significant those with a probability above 0.8.
Why would an instrument change alter that texture? According to the authors, two stretches of the same record can have a different effective resolution or different noise, and moving to a higher sampling rate (in their example, from a few readings a day to logging at 1 min intervals) would immediately produce stronger autocorrelations.
What was observed
At Bingley, two statistically significant changes appeared, in 1994 and in 1998, years in which observation switched from manual to automatic and the local airfield also changed. Smaller detections in 2007, 2011 and 2018 were related, according to information on the known instrument changes, to routine sensor replacements at that station. At Camborne and Carlisle, both analyses showed strong detections in the 1990s. The paper notes, in general terms, that in the 1980s and 1990s earlier analogue instruments were replaced with modern digital ones.
The detections were later confirmed by the available records of instrument changes for some of the stations. The authors stress that the effects observed are not climatic tipping points but short-term critical transitions, and they suggest these techniques could be used for condition monitoring of sensor networks, automatically and even in real time, and to identify instrument changes where documentation is missing.
What the study does not allow you to say
- It does not say how much. The method flags when the behaviour of the record changes, not how far the humidity shifts: the paper gives no magnitudes in percentage points of relative humidity or in degrees of dew point, so on its own it is not enough to correct a record.
- It does not separate causes. The authors write that they did not attempt to distinguish different types of sensor issues. At Bingley, the change of technique and the change of surroundings also coincide in time.
- The date is approximate. According to the authors, the timing of a change can be identified, if necessary, with a small uncertainty of several weeks; even so, that matters when you match it against a maintenance log.
- Equipment and data. These are hygrometers in a national network over decades, with a shift from analogue to digital instruments and from manual to automatic observation, not stand-alone loggers in a warehouse or a greenhouse. And the relative humidity is calculated, not measured.
- Region and record length. These are UK stations. The study does not test whether the method behaves the same way in drier climates or climates with a stronger seasonal contrast, such as much of the Iberian Peninsula, nor does it set a minimum record length: with windows of 10 % applied to records spanning decades, it is unknown how it would perform on a record of one or two years.
What it changes in a measurement decision
A single study is not a consensus, and this one deals with decades-long records from an official network. Even so, what was observed at these stations supports a few simple decisions for anyone logging humidity:
- Log every sensor change: date and time, model and serial number of the sensor removed and the one fitted, and the reason. In this study, detections could only be confirmed where a record of changes existed; without one, a step in the record remains unexplained.
- Also log what changes around the sensor and in the configuration. At Bingley, the switch to automatic observation and a change of airfield coincided, and the authors note that moving to a higher sampling rate would immediately produce stronger autocorrelations. Changing the logging interval partway through a record is a change of method, even if the sensor stays the same.
- Before reading a trend, cross-check the dates. If your humidity record changes behaviour, check whether it coincides with a replacement, a recalibration or a move of the sensor. It is the same logic we applied to temperature records in this earlier piece on short records and metadata.
- Do not mistake detection for correction. Knowing that something changed does not tell you by how much. Estimating that requires a comparison with a reference, which this study does not make.
References
- Livina, V. N., Willett, K. and Bell, S. (2025). Tipping point analysis helps identify sensor phenomena in humidity data. Geoscientific Instrumentation, Methods and Data Systems, 14, 541-564. DOI: 10.5194/gi-14-541-2025. Full text on the journal website (accessed 28 October 2026).
Commercial selection by EIC Controls
The S-THC-M002 temperature and relative humidity smart sensor works with Onset data loggers that accept smart sensors and, according to its datasheet, stores its own parameters and communicates its configuration to the logger without programming. For relative humidity, the datasheet states ±2.5 % from 10 % to 90 % (typical), to a maximum of ±3.5 % including hysteresis at 25 °C, and typical drift of less than 1 % per year, a figure that helps plan when to check or replace it and to keep that in the log. Still to be sized: the logger or station, the solar radiation shield the datasheet recommends mounting it in, and the maintenance log.
Instruments for this application
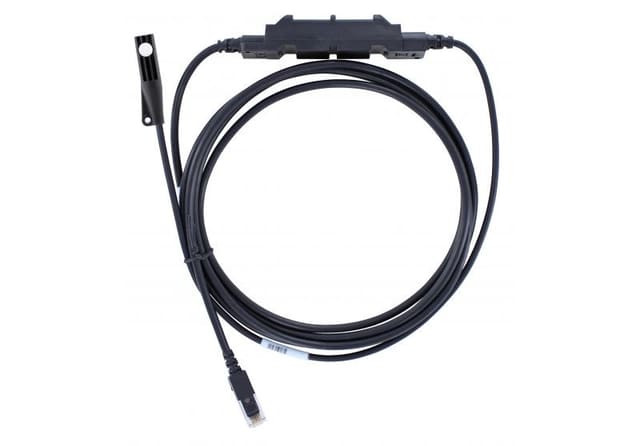
LI-COR (HOBO, InTemp, LI-COR) · S-THC-M002
Temperature/Relative Humidity (2m cable) Smart Sensor
The Temperature/Relative Humidity Smart Sensor is designed to work with all Onset data loggers that accept smart sensors. All sensor parameters are stored inside the smart sensor, which automatically communicates configuration data information to the logger…
Keep reading
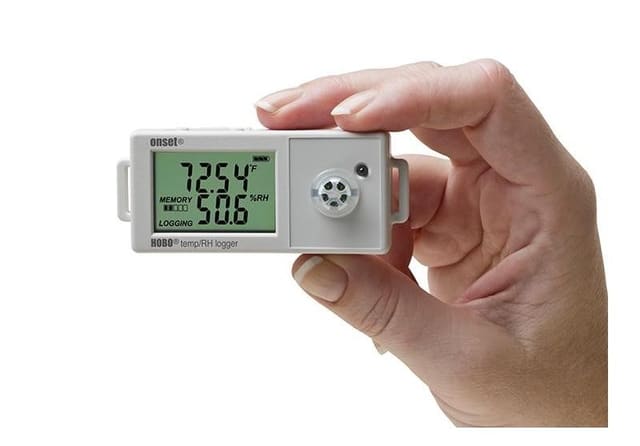
Monitoring the climate of a museum or church: how often to log, for how long and at how many points
One hour or less between readings, at least 13 months of data to apply the EN 15757 standard, and a first campaign with many points before deciding how many loggers to keep. These are the decisions supported by two studies in Valencia museums and a US National Park Service guide.
Week in review, 26 to 30 October 2026: what to note down alongside the data
The week's four articles (the logger's clock, the vaccine refrigerator, the European climate resilience law and replacing a humidity sensor), three signals with their sources (the Commission's new tools, the WMO greenhouse gas bulletin and climate indicators for tourism in southern Catalonia) and what comes next: COP31 from 9 November.
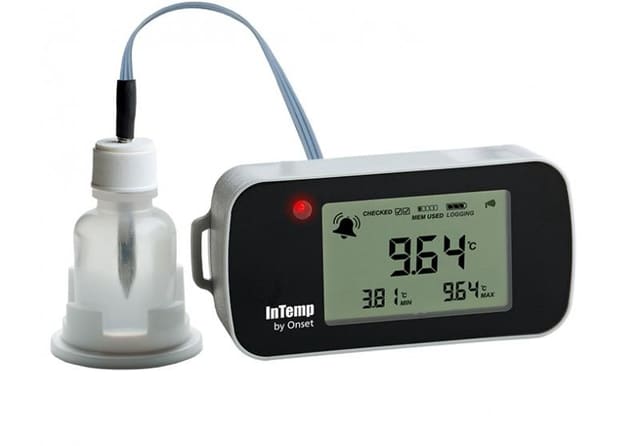
Is it really between 2 and 8 °C? Where to put the probe in a vaccine refrigerator and what to log
In a German study of 75 vaccine refrigerators, only 24 stayed between 2 and 8 °C over seven days of logging. How to decide where the probe goes, whether it sits in air or in a buffer, how often to log and who reviews the data, drawing on guidance from Madrid and the Basque Country.