
Data logging · Temperature and humidity
A record at your station does not mean the same with 5 years of data as with 30: what AEMET's record count shows
On 23 September 2026 AEMET published an analysis of temperature records: in Spain, between 2016 and 2025, there were 221 warm-day records against 7 cold-day records, when 51 of each were expected. What a record means at your own measurement point and what to log so that it means something.
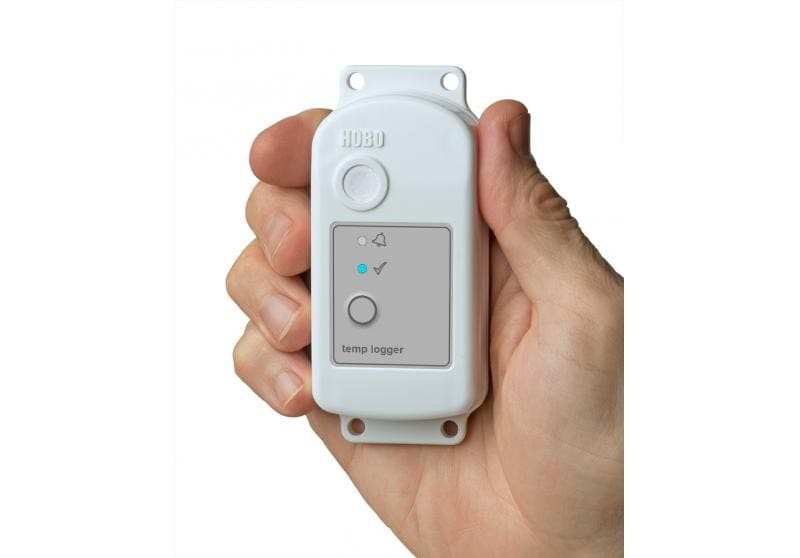
When a data logger shows the highest value it has ever recorded, it is tempting to call it a record. Whether it is one, and whether it means anything, depends on two things: how many years the series covers and whether all those years were measured in the same way. An analysis that AEMET, the Spanish State Meteorological Agency, published last week makes this easy to see in numbers.
What AEMET published
On 23 September 2026, AEMET's blog published «Un planeta de récord» ("A record-breaking planet"), an article by Benito Fuentes, a meteorologist at AEMET. Using data it attributes to the report on the state of the climate of Spain 2025, the article states that between 2016 and 2025 Spain recorded 221 warm-day records against 7 cold-day records. The theoretical expected value for that period was 51 records of each type: warm records were about four times more frequent than expected and cold records almost eight times less frequent.
At global scale, the article analyses Berkeley Earth monthly mean temperatures from January 1850 to December 2025. It does not work with daily records or with daily maximum or minimum records, but with records of monthly mean temperature. Across large parts of the planet, for every warm record that would be expected in a climate dominated by natural variability, more than six have been recorded (a ratio above 600%). The author also notes that temperature distributions are not only shifting towards higher values but also widening, and concludes that the current behaviour of monthly mean temperatures can no longer be explained by natural variability alone.
The rule behind the "expected value"
For its global analysis, the article explains the rule behind the expected value: the probability that the value for year N sets a new record is 1/N. With monthly means, twelve values a year, 12/N records are expected in year N. That is the benchmark for a climate dominated by natural variability; what the article measures is how far the observations depart from it.
Applied to your own measurement point, the rule has a practical consequence. With no underlying trend, in the second year of logging each value has a 1 in 2 chance of beating the record of its series; in the fifth year, 1 in 5. With monthly means, about 2.4 records are expected in the fifth year of a series (12/5), and about 0.4 in the thirtieth (12/30). A record at a newly installed station is not yet a signal: it is what the arithmetic predicts.
What to measure so that a record means something
The rule compares each value with all the previous values in the same series. That comparison only makes sense if they were all measured in the same way. Four decisions protect it:
- Do not move the point. Same place, same height, same orientation. If it has to move, note the date: from that day on, a record no longer compares like with like.
- Do not change the mounting without recording it. Sensor, radiation shield and bracket are part of the measurement. One example: the datasheet of the logger we suggest below gives a typical response time of 17 minutes without a shield and 24 minutes with one of the shields it lists (to 90% of the change, in air moving at 1 m/s). The same sensor follows the air differently depending on how it is mounted. We cover that choice in how to choose a radiation shield.
- Set the logging interval and mode, and keep them. A logger only stores what it samples. With one reading an hour, a peak shorter than an hour can fall between two readings; so a daily maximum taken from hourly readings is not comparable with one taken from readings every minute. Choose the interval at the start and do not change it halfway through the series.
- Write down the metadata. Installation date, height, shield, interval, logging mode, calibrations and incidents (battery, dirt, new shade). Without that record, ten years from now you will not be able to tell whether a record came from the weather or from the installation.
If your series is short, compare it with a nearby official station before talking about records. What your point adds is local detail; for now, the length of the series comes from the official network. It is the same idea we applied to anomalies in summer 2026 in western Europe: a regional figure does not describe your point, and your point, with only a few years, does not yet describe the climate.
What is still unknown
- The article does not define what counts as a warm-day or cold-day record in the Spanish series, nor does it detail how the expected value of 51 is obtained; it refers to the report on the state of the climate of Spain 2025.
- The counts end in December 2025. Any records set in 2026 are not in these figures.
- The pattern is not uniform. The article points to abnormally low values in the North Atlantic south of Greenland, a region that has cooled over recent decades and whose behaviour it links to the weakening of the AMOC (the Atlantic Meridional Overturning Circulation).
- A count describes how often records appear across many series. On its own, it does not explain a specific record at a specific point.
Commercial selection by EIC Controls
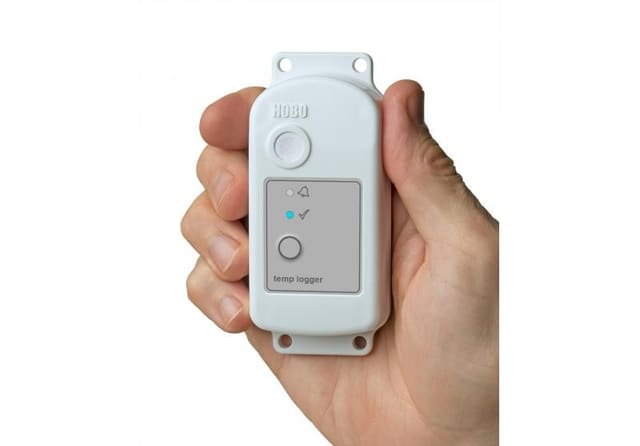
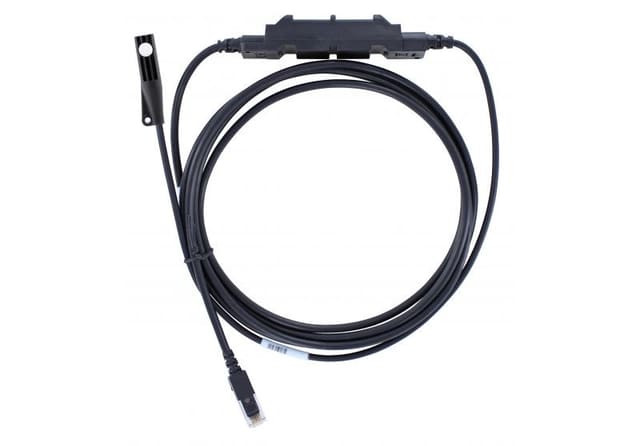
The MX2305 is a temperature data logger with an internal sensor in a weatherproof housing (IP67), with a configurable logging interval from 1 s to 18 h and normal, statistics or burst logging modes. To sustain a long series at your point, its datasheet states drift below 0.01 °C per year and accuracy of ±0.2 °C from 0 to 70 °C (±0.25 °C from -40 to 0 °C). The solar radiation shield, the installation height and the Bluetooth download routine (approximately 30 m line-of-sight range) still need to be sized.
See datasheet · Talk to a specialist
References
- Fuentes, B. (AEMET) (2026). «Un planeta de récord». AEMET blog, 23 September 2026. https://aemetblog.es/2026/09/23/un-planeta-de-record/ (accessed 30 September 2026, 06:50 Madrid time).
Instruments for this application
LI-COR (HOBO, InTemp, LI-COR) · MX2305
HOBO MX2305 Temperature Data Logger
The HOBO MX2305 is a weatherproof data logger with an internal temperature sensor. Leveraging Bluetooth Low Energy, the logger enables easy, fast set up and data download directly from your mobile device, and provides high-accuracy measurements in harsh…
Keep reading
Monitoring the climate of a museum or church: how often to log, for how long and at how many points
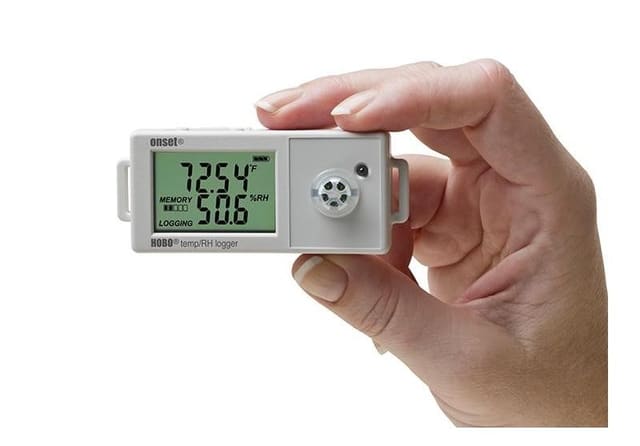
One hour or less between readings, at least 13 months of data to apply the EN 15757 standard, and a first campaign with many points before deciding how many loggers to keep. These are the decisions supported by two studies in Valencia museums and a US National Park Service guide.
Week in review, 26 to 30 October 2026: what to note down alongside the data
The week's four articles (the logger's clock, the vaccine refrigerator, the European climate resilience law and replacing a humidity sensor), three signals with their sources (the Commission's new tools, the WMO greenhouse gas bulletin and climate indicators for tourism in southern Catalonia) and what comes next: COP31 from 9 November.
Replacing a humidity sensor can leave a mark in the record: what a study of 55 UK stations found
A study of 55 UK stations detected changes in measurement technique in humidity records; at one station, smaller detections were linked to routine sensor replacements. What it allows you to conclude, what it does not, and what to log in your own record.