
Data logging · Weather monitoring
Summer 2026 was western Europe's warmest on record: what changes at your measurement point
Copernicus issued its August assessment statement on 10 September 2026: a record summer in western Europe, with anomalies referenced to 1991 to 2020. What those figures say, and do not say, about a series of your own.
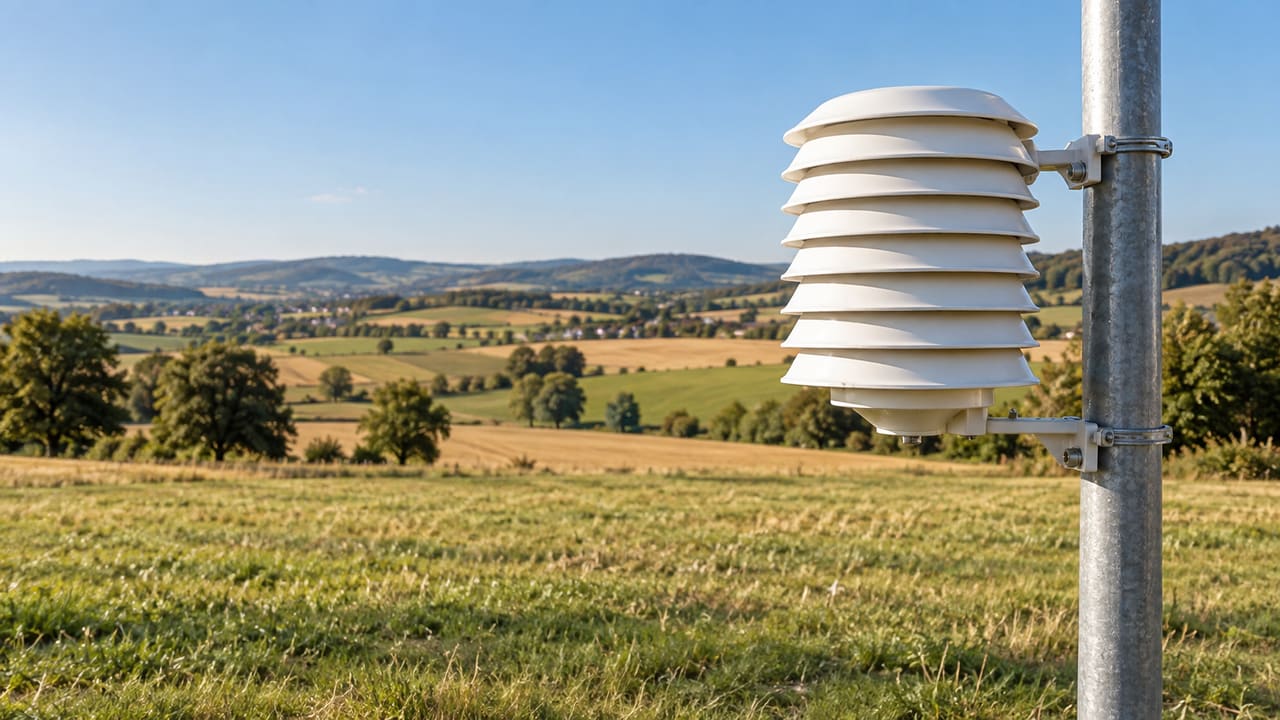
The Copernicus Climate Change Service (C3S) published its monthly surface air temperature bulletin for August 2026, and on 10 September 2026 issued the statement with the month's assessment. For anyone keeping a temperature record of their own, that bulletin is more than a climate headline: it is the reference many people compare their data against without noticing what they are comparing.
The figures, as Copernicus publishes them
According to the C3S bulletin on surface air temperature for August 2026:
- August 2026 was the warmest August in the global record, with an average surface air temperature of 16.96 °C, that is 0.85 °C above the 1991 to 2020 average for the month.
- The average over European land in August 2026 was 20.26 °C, 1.10 °C above the 1991 to 2020 average, the fourth warmest August in the ERA5 dataset.
- Summer (June to August 2026) over European land was 1.17 °C above the 1991 to 2020 average, the third warmest summer for Europe in ERA5.
- Over the western European region, the seasonal average was the highest on record: 21.69 °C, 2.54 °C above the 1991 to 2020 average.
In that statement, C3S also places August 2026 at 1.65 °C above the 1850 to 1900 pre-industrial level and gives an extra-polar sea surface temperature of 21.07 °C, the highest on record for an August.
It is worth noticing what looks like small print: every one of those anomalies is referenced to the period 1991 to 2020. The number that reaches the headlines (plus 1.10 °C, plus 2.54 °C) is not a temperature, it is a distance from one particular thirty-year window. Change the window and the number changes.
A continental average does not describe a measurement point
The same bulletin notes slightly below-average temperatures across northern Europe, from Iceland to Fennoscandia and the Baltic countries. Within one continent and one summer, then, a seasonal record in the west sits alongside negative anomalies in the north.
Very little about a specific site follows from a continental average. A valley, a warehouse, a greenhouse, a chamber or a field plot each answer to their own exposure, their own thermal inertia and their own ventilation. The European figure frames the context; it does not replace a series measured on site.
What to measure, and with what care
Four practical consequences for a logging campaign:
- Record the reference period alongside the series. If a threshold or an expectation of what counts as normal was built from 1991 to 2020 data, write that into the documentation for the point. A series with no stated reference cannot be compared with anything two years from now.
- Measure duration, not only maxima. A monthly record is built from averages; an operational decision usually turns on how many consecutive hours a value was exceeded. That calls for a logging interval fine enough to count hours, not just a daily maximum.
- Compare a series with itself. The useful comparison is the same point across two seasons, with the same sensor and the same installation. Setting a local series against a regional average mixes two things that do not measure the same quantity.
- Separate the sensor from the installation. The accuracy printed on a datasheet describes the sensor; it says nothing about where the sensor was placed or how it was exposed. Shielding from direct radiation, mounting height and ventilation at the point are sized on site.
What the bulletin does not say
The bulletin publishes ERA5 values as monthly and seasonal averages. It does not say how many hours any particular site spent above a threshold, nor how far a given point departed from its own usual behaviour. Nor does it anticipate whether the pattern will repeat next year.
A seasonal record in one region is equally no licence to carry percentages or thresholds across from one crop, climate or instrument to another. What is clear is the direction of the work: if the reference everyone looks at is moving, the only series still describing a site is the one measured at that site.
References
- Copernicus Climate Change Service (C3S), ECMWF, 2026. Surface air temperature for August 2026. Accessed 13 September 2026. https://climate.copernicus.eu/surface-air-temperature-august-2026
- Copernicus Climate Change Service (C3S), ECMWF, 10 September 2026. August was the world's joint hottest month on record, pushing global temperatures back above 1.5 °C. Accessed 13 September 2026. https://climate.copernicus.eu/copernicus-august-was-worlds-joint-hottest-month-record-pushing-global-temperatures-back-above
Commercial selection by EIC Controls
The HOBO Temperature/RH Data Logger (MX2301A) measures air temperature and relative humidity and stores the series in the unit itself, with wireless setup and download over Bluetooth Low Energy. Its datasheet gives a temperature range of minus 40 to 70 °C, accuracy of ±0.2 °C between 0 and 70 °C and a resolution of 0.04 °C, alongside a relative humidity sensor covering 0 to 100 % with typical accuracy of ±2.5 % between 10 % and 90 %: figures suited to building the local series this article is about. What still has to be sized in each case is the exact installation point, shielding from direct solar radiation, the logging interval and how the data will be retrieved.
Instruments for this application
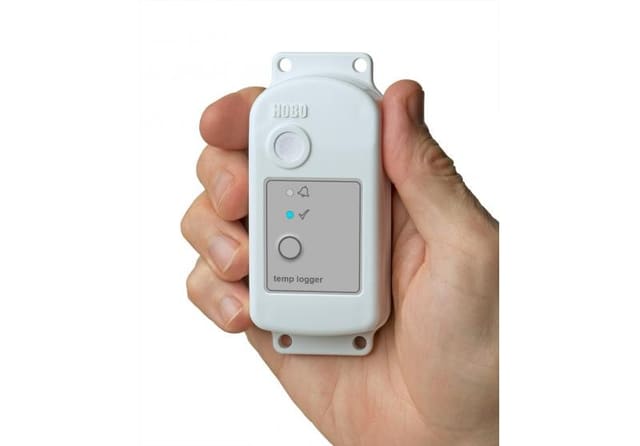
LI-COR (HOBO, InTemp, LI-COR) · MX2301A
HOBO Temperature/RH Data Logger
The HOBO MX2301 is a weatherproof data logger with built-in temperature and relative humidity sensors. Leveraging Bluetooth Low Energy, the logger enables easy, fast set up and data download directly from your mobile device, and provides high-accuracy…
Keep reading
Week in review, 14 to 18 September 2026: your own point, the satellite and the laboratory curve
Three articles on what makes a number measured at one point trustworthy, three European signals from the week with their sources, and what is due in the coming days.
Sentinel-3C is in orbit: what a satellite measures and what your station still measures
On 15 September 2026 the European Union launched Copernicus Sentinel-3C. What it observes from 800 km, why land surface temperature is not air temperature, and what to log at your own point.
Why two identical sensors do not read the same: choosing a radiation shield
The shield around the sensor can contribute more error than the sensor itself. What two peer-reviewed studies say about natural ventilation and forced aspiration, and what to document so the series is usable.