
Data logging · Installation and calibration
Where to put the CO2 monitor in a classroom: what a study in schools and a university around Barcelona measured
A study published in 2025 compared CO2 readings at different points in Barcelona classrooms under several types of ventilation. In these classrooms, position and ventilation often mattered more than sensor accuracy, with differences of more than 100 ppm.
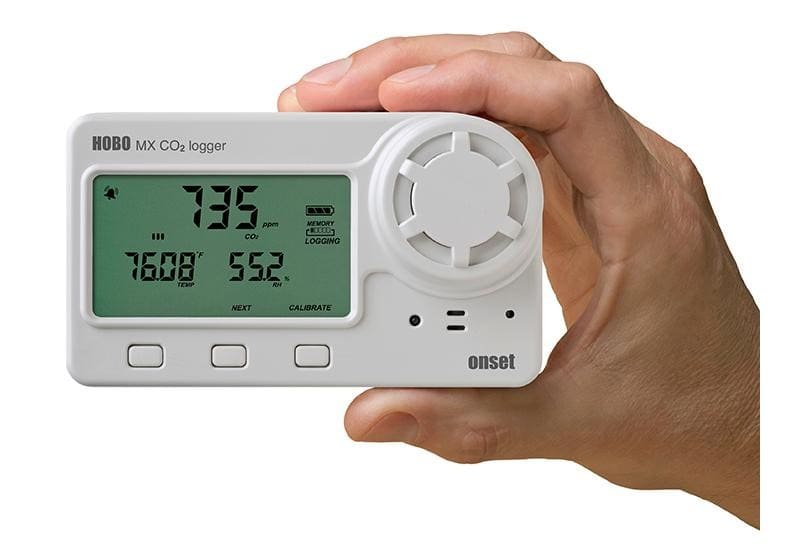
If you need to measure CO2 in a classroom, the first decision is not which instrument to buy but where to put it and how many to use. A study published online in February 2025 in the journal Indoor Air, carried out in primary school and university classrooms in the Barcelona area, measured how much the reading changes with the position of the sensor and with the way the room is ventilated. In the authors' words, position and ventilation strategy "often outweigh the sensor specifications", with differences between points in the room of more than 100 ppm.
The study's question
The CO2 recorded by a monitor is used as an indicator of whether a classroom is adequately ventilated. The authors, from the Universitat Politècnica de Catalunya (UPC), started from the observation that measurements often overlook the sensor's specifications, its position relative to the airflow path and to the occupants, and how these relate to the room's ventilation. They wanted to find out what matters most, in order to propose how to standardise such measurements in classrooms.
How it was done
- Where and when. 33 measurement sessions over 5 months of the 2021-2022 academic year, covering summer and winter periods: 24 in UPC buildings and 9 in seven classrooms at three schools near Barcelona.
- The classrooms. Similar volume and layout of doors and windows, 160 ± 20 m³, with an average of about 20 students, which is about 8.15 m³ per occupant.
- The instruments. Five commercial units of four models: two Comet U3430, one DeltaOHM HD32.3TC, a Sensirion SCD30 module read with a Raspberry Pi, and one Elitech RC5. All were used with their factory calibration.
- Placement. On top of desks, at breathing height, at least 1 m from occupants and walls. In some sessions the units sat together, to compare them with one another; in others they were spread around the room, to see how much CO2 changes from one point to another.
- Ventilation. Four situations: none (doors and windows closed), single-sided natural, cross natural (openings on at least two sides of the room) and mechanical.
- The indicator. Data synchronised to 1 minute and, alongside the CO2 value, its rate of change (dCO2/dt), which shows whether CO2 is rising or falling at each point.
What was observed
Units placed together differed less than points across the room. With the units at the same spot, the mean standard deviation was 17.74 ppm between the two units of the same model and 37.35 ppm across all units, with a maximum difference of 80 ppm. With the units spread around a closed room, the mean standard deviation between readings rose to 97.24 ppm.
Ventilation changes the room's map. According to the authors, without ventilation CO2 is at the mercy of its sources, and over time differences of the order of 100 ppm can appear. Natural ventilation, single-sided or cross, creates air streams that redistribute CO2 according to the shape of the room, which is why sensor position matters. Mechanical ventilation overrode the other variables, but it was measured in only one classroom.
The "obvious" spot may stop being the right one. A UPC project had installed CO2 sensors in its classrooms aiming for the spot with the highest concentration; as placing them among the students was impractical, it put them on the wall opposite the windows. The assumption held with single-sided natural ventilation; once doors and windows were opened at the same time, that spot sat in the air stream between them and no longer recorded the highest values.
Where CO2 was highest. With natural ventilation, away from airflow paths, that is, away from doors, windows and the open space between them. Without ventilation, close to the occupants.
For the authors, sensor accuracy often matters less than ventilation and the exact position, which change the local reading by more than the instrument's accuracy.
How far the results transfer
- Type of room. Classrooms of similar volume and layout, with about 8.15 m³ per occupant. A more crowded or larger room, or one with a different arrangement of doors and windows, may have a different map.
- Mechanical ventilation. Only one classroom with mechanical ventilation was studied. The authors limit the result to classrooms with sufficiently effective mechanical ventilation.
- Climate and region. Classrooms in the Barcelona area, over a single academic year. With another climate or other window-opening habits, the air streams and the map may change.
- Instruments. Four commercial models with factory calibration, at breathing height: the spread figures belong to these instruments and sessions, not to CO2 sensors in general.
- Temperature. The units also measured temperature, but the spread between them (mean standard deviation of 0.57 °C when placed together) masked the differences between positions, and the placement analysis used CO2 only.
- The correction of about 100 ppm. For cases where neither several sensors nor ventilation records are feasible, the authors suggest, in classrooms like theirs and without mechanical ventilation, adding about 100 ppm to the reading when the sensor is not in what they call the least favourable positions (with natural ventilation, those away from the air streams). It approximates the variation between positions under steady-state conditions in these classrooms; it does not apply to another room without measuring it.
What it changes in a measurement decision
- Decide on the spot before the instrument. In this study position mattered more than the difference between models, so a higher-end instrument does not on its own make up for an unrepresentative spot.
- Place it according to how the room is ventilated. If the room is ventilated by opening windows or doors, avoid the line between them; if it is usually closed, the highest CO2 was found close to the occupants, and in the study no unit was placed less than 1 m from a person.
- More than one point, at least at first. The authors recommend deploying several sensors, both within and outside the main air streams, to detect the differences. That then helps decide how many to leave and where.
- Record ventilation alongside the data. The authors propose supplementing CO2 readings with ventilation data, because readings can vary by up to 100 ppm. Without noting what was open and when, two identical values can mean different things.
- Compare the units together before spreading them out. The study also measured with all units at the same spot. That shows how much they differ from one another, so that a difference between positions is not mistaken for a difference between instruments.
- Look at the trend, not only the value. With a short interval (the study used 1-minute data), the rate of change shows where CO2 falls faster, such as at points within the air stream.
The framing bears repeating: this is what was observed in this study, in these classrooms and with these instruments, not a general rule. The question, however, applies to any room: what does the measuring point represent?
References
- Marín, D.; Alegría-Sala, A.; Canals Casals, L.; Macarulla, M.; Fonollosa, J. (2025). The Reliability of CO2 Measurements Using Low-Cost Sensors: A Study of Sensor Positioning and Ventilation Strategies in Classrooms. Indoor Air, 2025, 5517242. DOI: 10.1155/ina/5517242. Full text (publisher's version, CC BY 4.0 licence) in the UPCommons repository of the Universitat Politècnica de Catalunya: https://upcommons.upc.edu/server/api/core/bitstreams/1ac146ad-023f-4b20-b775-8c26439b253a/content. Accessed 30 September 2026.
- Crossref (2026). Metadata record for DOI 10.1155/ina/5517242 (no correction or retraction marks on the date of access). https://api.crossref.org/v1/works/10.1155/ina/5517242. Accessed 30 September 2026.
Commercial selection by EIC Controls
The Bluetooth Low Energy Carbon Dioxide/Temp/RH Data Logger (MX1102A) measures CO2 from 0 to 5,000 ppm by non-dispersive infrared (NDIR) absorption, as well as temperature and relative humidity, with a logging interval configurable from 1 second and visual and audible high and low alarm thresholds, according to its datasheet. In a classroom, several units make it possible to repeat this study's procedure: first together, to compare them, then spread around the room. The number of units, where to place them relative to doors, windows and occupants, and how the data will be downloaded (Bluetooth or USB) still need to be sized.
Instruments for this application
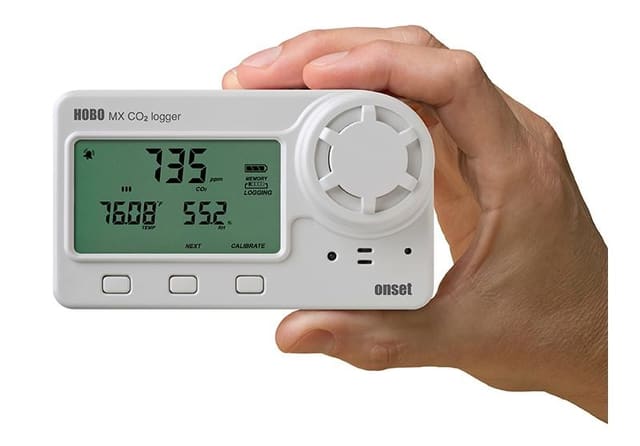
LI-COR (HOBO, InTemp, LI-COR) · MX1102A
Bluetooth Low Energy Carbon Dioxide/Temp/RH Data Logger
Onset’s HOBO MX1102A CO2 logger makes it more convenient than ever to measure and record CO2 in buildings and other non-condensing environments. It measures CO2 from 0 – 5,000 parts per million (ppm) – and our free HOBOmobile app allows you to access data…
Keep reading
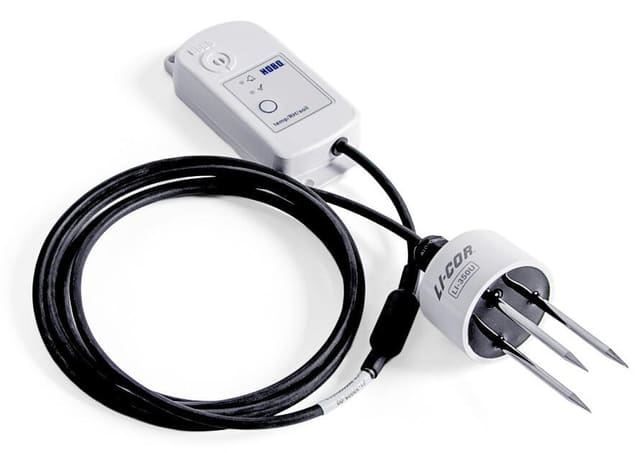
Field calibration or laboratory curve: what one study measured with soil moisture sensors
A study published in May 2026 calibrated low-cost capacitive sensors in the laboratory and then moved them to real plots. The laboratory curve drifted in the field, and a single reference measurement on site recovered much of the accuracy.
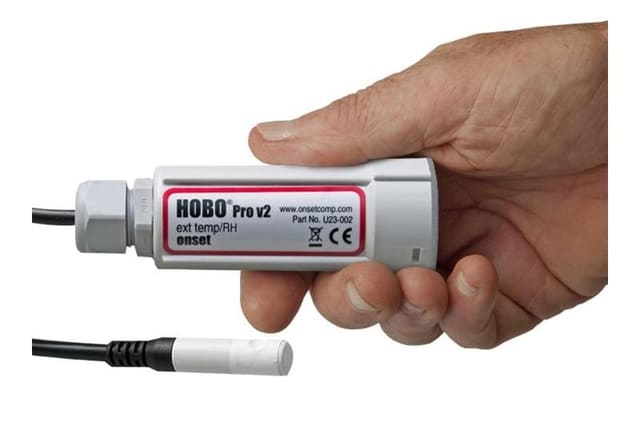
Why two identical sensors do not read the same: choosing a radiation shield
The shield around the sensor can contribute more error than the sensor itself. What two peer-reviewed studies say about natural ventilation and forced aspiration, and what to document so the series is usable.
How long does biofouling take to spoil a conductivity record? What a study with moored sensors in the Baltic measured
In a study off the southern Baltic coast, a conductivity sensor moored at 2 m with a used TBT cell was out of specification at the first comparison after deployment, on day 32; with a UVC emitter, the last references, after 237 days, were within the margin. What this changes when planning visits and references.