
Weather monitoring · Agriculture and soil
Is temperature enough to estimate ET0? What a study of 45 agricultural weather stations in Aragón found
At 45 SIAR network stations in Aragón (2004-2024), ET0 calculated from temperature alone rose at 36, while Penman-Monteith ET0 showed no significant trend at 33 and fell at 12. What this study allows you to conclude about which variables to measure, and what it does not.
Many irrigation decisions start from reference evapotranspiration (ET0). When the only instrument on a plot is a thermometer, it is tempting to calculate ET0 with a formula that uses temperature alone and, with temperatures rising, to expect ET0 to rise year after year. A study published in 2026 in the journal Irrigation Science put that intuition to the test with daily data from 2004 to 2024 from agricultural weather stations in Aragón, Spain. In this study, the answer depended on which variables went into the calculation.
The study's question
Nery Zapata, Eva T. Medina and E. Playán set out to find whether the warming observed in Aragón translates into higher evaporative demand and more water for crops. To answer it, they compared two ways of calculating ET0:
- Hargreaves-Samani, which needs only mean, maximum and minimum temperature, plus extraterrestrial radiation, calculated from latitude and day of the year.
- FAO Penman-Monteith (FAO-56), which also needs air humidity, radiation and wind speed at 2 m.
How it was done
- Stations: 49 automatic weather stations of the SIAR network in Aragón (22 in Huesca, 21 in Zaragoza and 6 in Teruel). They record half-hourly and daily averages of air temperature and relative humidity, wind speed and direction, solar radiation and precipitation. The network was created in 1998 by the Spanish Ministry of Agriculture together with the regional governments, to estimate crop water requirements in irrigated areas.
- Screening: years with more than five consecutive days of missing data were excluded, and stations with at least 17 years of quasi-complete data were kept. That left 45, with records of 17 to 21 years. Remaining gaps were filled with data from the nearest station.
- Analysis: annual, seasonal and monthly trends with the Mann-Kendall test and Sen's slope, with a significance threshold of p < 0.05; the figures quoted here are the annual ones. In addition, growing degree day models for the stages of maize and several fruit crops, and the evapotranspiration of those crops (ETc).
What was observed
Temperature rose almost everywhere. Annual mean temperature increased significantly at 43 of the 45 stations, at an average rate of 0.08 °C per year; maximum temperature at 44 (0.10 °C per year) and minimum temperature at 33 (0.06 °C per year).
With the same data, the two formulas gave different results:
- Hargreaves-Samani ET0 increased at 36 of the 45 stations, with an average slope of 11.68 mm per year at those 36 (from 7.48 to 17.37 mm per year).
- Penman-Monteith ET0 showed no significant trend at 33 stations and decreased at the other 12, at an average rate of 6.08 mm per year at those 12 (from 2.09 to 10.38 mm per year). It did not increase significantly at any station.
The difference lies in the variables the temperature formula does not use. Mean wind speed fell significantly at 34 stations (0.02 m/s per year on average), relative humidity rose at 21 (0.32% per year) and annual solar radiation fell at 7 (22.13 MJ/m² per year). Annual precipitation showed no significant trend, apart from a slight increase at one station. According to the authors, these shifts in radiation, wind and humidity offset the rise in temperature and decoupled evapotranspiration from warming.
Something similar happened with the crops. Growth stages became shorter (for long-season maize, stage III was significantly shorter at 18 stations and stage IV at 20), and that acceleration stabilised cumulative seasonal ETc. The authors conclude that rising temperature alone does not necessarily mean higher evaporative demand or higher crop water use.
How far it transfers
- Region, climate and crops. These are stations in the irrigated areas of Aragón, with a Mediterranean or Mediterranean continental climate, and growth stages and ETc were calculated only for maize and several fruit crops. In another climate, the trends in wind, humidity and radiation may be different, and so may the gap between the two formulas.
- Scale. These are annual, seasonal and monthly trends between 2004 and 2024, not daily values. The study does not say how far the temperature formula is off on a particular irrigation day.
- Equipment. The paper does not give sensor models, heights or calibrations. The authors note that the results are ultimately constrained by the accuracy and the consistency of maintenance of the stations.
- Method. Hargreaves-Samani was applied with its original coefficient of 0.0023. FAO-56 asks for that formula to be verified in each new region against Penman-Monteith and calibrated if necessary.
A single regional study is not enough to extend its trends to the rest of Spain: in this study, in Aragón and over this period, temperature alone did not describe the trend in evaporative demand well.
What it changes in a measurement decision
- If ET0 is going to guide irrigation or water planning, measure all four variables. FAO-56 states that the Penman-Monteith equation needs maximum and minimum temperature, actual vapour pressure, net radiation and wind speed at 2 m. The stations in this study measure air temperature and relative humidity, wind and solar radiation for that purpose. In this study, relying on temperature alone would have pointed to rising ET0 at 36 stations, whereas the full equation showed a rise at none.
- If you only have temperature today, check the formula before trusting it. FAO-56 asks for the Hargreaves equation to be compared, in each new region, with Penman-Monteith at stations where those four variables are measured, and allows it to be calibrated with monthly or annual coefficients. It also warns that the equation tends to underpredict in high wind (u2 > 3 m/s) and to overpredict at high relative humidity. Spain's SIAR network publishes daily Penman-Monteith ET0 for its stations, which can serve as a reference for that comparison.
- Measure wind at 2 m or correct it. FAO-56 requires wind speed measured 2 m above the surface. If the anemometer is at another height, it proposes a correction using a logarithmic wind profile, for measurements above a short grass surface.
- Record maintenance and every change. Among the trends that offset the warming in this study were an average fall in wind speed of 0.02 m/s per year (at 34 stations) and an average rise in relative humidity of 0.32% per year (at 21). To be able to read a trend in your own record, write down every change of sensor, height, calibration and surroundings at the measurement point.
To choose the radiation sensor, see also PAR or global solar radiation? Choosing a light sensor.
References
- Zapata, N.; Medina, E. T.; Playán, E. (2026). Meteorological drivers modulate evapotranspiration trends under climate warming in Northeastern Spain. Irrigation Science, 44(4), 81. DOI: 10.1007/s00271-026-01117-1. Full text (CC BY 4.0 licence): https://link.springer.com/article/10.1007/s00271-026-01117-1. Accessed 7 October 2026.
- Crossref (2026). Metadata record for DOI 10.1007/s00271-026-01117-1 (no correction or retraction marks on the date of access). https://api.crossref.org/v1/works/10.1007/s00271-026-01117-1. Accessed 7 October 2026.
- Allen, R. G.; Pereira, L. S.; Raes, D.; Smith, M. (1998). Crop evapotranspiration: Guidelines for computing crop water requirements. FAO Irrigation and Drainage Paper 56, chapter 3: Meteorological data. https://www.fao.org/4/x0490e/x0490e07.htm. Accessed 7 October 2026.
Commercial selection by EIC Controls
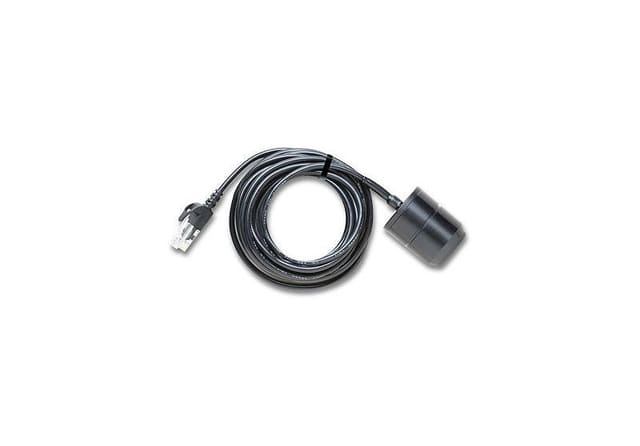
The Solar Radiation (Silicon Pyranometer) Smart Sensor (S-LIB-M003) measures, according to its datasheet, solar radiation from 0 to 1,280 W/m², one of the four variables that the stations in this study measure for the Penman-Monteith equation. On a station that already records temperature, humidity and wind, it is the missing variable for calculating ET0 with the full equation rather than a temperature formula. Still to be sized: a compatible logger, which the datasheet lists as the H21, H22 and U30 families, temperature, humidity and wind sensors if not already in place, the bracket and level the datasheet recommends, and the installation point.
Instruments for this application
LI-COR (HOBO, InTemp, LI-COR) · S-LIB-M003
Solar Radiation (Silicon Pyranometer) Smart Sensor
Effectively measure light levels with this silicon pyranometer sensor. The Solar Radiation Smart Sensor enables rapid deployment. Since HOBO data loggers recognize this sensor, no complicated programming or setup is required. This product offers a measurement…
Keep reading
PAR or global solar radiation? How to choose a light sensor for the decision you need to make
Global solar radiation and PAR are not the same quantity and are not measured with the same sensor. Which decision needs which, how much the factor that converts one into the other changes with the sky, and what to record before installing.
August 2026 in Europe: dry surface soil, low rivers and what to measure now
On 10 September, Copernicus published its August 2026 bulletins: exceptionally dry surface soils and river flows well below average across much of Europe. What those maps support deciding, and what they do not.
Changing site or instrument without breaking the record: lessons from the Montseny summit series (1950-2025)
On 31 October 2026 AEMET and the SMC published an analysis of the Montseny summit series, which joins two sites and fills the gaps from 2001 to 2010. What it teaches anyone planning to move a station or change a sensor.