
Data logging · Weather monitoring
The Commission proposes a common warming trajectory for climate risk assessments: what to measure at your site to read it
On 27 October 2026 the European Commission proposed the European Climate Resilience Law, with a reference global warming trajectory and periodic risk assessments. What that information describes, what it does not describe about your site and what is worth recording.
Sources consulted on 28 October 2026, between 05:35 and 05:45 (Madrid time).
If you run a farm, an irrigation network, a building or a municipal service, you will hear more and more about a "warming trajectory" and a European climate viewer. The practical question for anyone who measures is which part of that information describes your own site and which part only a series of your own can provide.
What the Commission proposed on 27 October
On 27 October 2026 the European Commission put forward a proposal for a Regulation, the European Climate Resilience Law (COM(2026) 730, procedure 2026/0336 (COD)), together with a Communication on the EU Framework for Climate Resilience (COM(2026) 720) and three digital tools. For anyone working with data, three points stand out:
- A reference global warming trajectory for the short, medium and long term, set out in Annex I of the proposal, which the Commission could update by delegated acts (Articles 4 and 12).
- Periodic risk assessments. The European Environment Agency (EEA) would carry out a European climate risk assessment by 30 June 2028 and every five years thereafter; each Member State, a national climate risk assessment, "including at subnational level, where applicable", by 30 June 2029 and every five years thereafter. These assessments would be based "on at least" the reference trajectory (Article 5).
- The European Climate Viewer, which the proposal defines as the web tool, to be developed, that converts the trajectory into localised and decision-relevant information on projected climate hazards. The Commission has already put a viewer page online, which presents itself as harmonised climate hazard information across Europe based on Copernicus data.
To give a sense of scale, the explanatory memorandum notes that current global mitigation commitments are projected to lead to around 2 °C of global warming by 2050 and around 3 °C by the end of the century.
Context: from a one-off assessment to a cycle
The EEA's first European climate risk assessment, presented on 11 March 2024, identified 36 major climate risks for Europe and noted that southern Europe is particularly at risk from wildfires and from the impacts of heat and water scarcity on agricultural production, outdoor work and human health. The same news release acknowledged knowledge gaps. The proposal turns that exercise into a five-year cycle.
The Communication accompanying the law lists among its aims improving pan-European datasets to implement the trajectory at national, regional and local levels, and improving the monitoring of climate hazards.
What to measure at your site
A trajectory tells you how much the global climate warms; a viewer translates that into projected hazards on a pan-European basis. Neither describes what the climate is like today in your field, on your roof or at your reservoir. To read "more heat" or "less water" at your site, you need a reference from the site itself. Whatever the final text, these measurement decisions make it useful:
- Measure the hazard, not just the mean. Heat shows in daily maxima and minima, recorded and analysed separately (as we saw with September 2026 in Spain). For water scarcity, what counts is rainfall, logged at an interval short enough to show intensity and not just the total, and evapotranspiration, if the decision is about irrigation.
- Do not move the site. Same location, same height and same radiation shield (why the shield matters). Every change, with its date, in the metadata.
- Document the time base. Note whether the logger stores local time or UTC; without that, summer and winter series do not line up (the clock change).
- Validate before comparing. Keep the raw data, flag gaps and doubtful values, and only then compare them with the nearest official station or with a map.
- Read records with caution. A series only a few years long breaks records through simple arithmetic (records and series length).
A series starting this winter would be less than three years long by June 2029. That is too short to talk about climate, but it already lets you compare your site with the nearest official station on the same days and see how far it departs from it.
What is not yet known
- The final text. This is a proposal: the European Parliament and the Council handle it under the ordinary legislative procedure, and the dates, the annex and the obligations may change.
- The trajectory values over time, which the Commission could update by delegated acts.
- The scale of the viewer. The texts consulted do not describe the spatial resolution or the limits of local use of the European Climate Viewer.
- Support at local level. The Commission announces an implementation plan within six months of the law's adoption.
This article describes a legislative proposal; it does not interpret what obligations any particular organisation would have, nor is it a substitute for legal advice.
References
- European Commission (2026). Proposal for a Regulation of the European Parliament and of the Council establishing a framework to enhance climate resilience and amending Regulation (EU) 2018/1999 (European Climate Resilience Law). COM(2026) 730 final, 27/10/2026. Document. Accessed 28/10/2026.
- European Commission (2026). A resilient Europe for a changing climate. Communication on the EU Framework for Climate Resilience. COM(2026) 720 final, 27/10/2026. Document. Accessed 28/10/2026.
- European Commission (2026). Protecting Europe with stronger climate-resilience. News, 27/10/2026. Page. Accessed 28/10/2026.
- European Commission, DG Climate Action (2026). EU Framework for Climate Resilience. Page. Accessed 28/10/2026.
- Copernicus (2026). European Climate Viewer. Page. Accessed 28/10/2026.
- European Environment Agency (2024). Europe is not prepared for rapidly growing climate risks. 11/03/2024. Page. Accessed 28/10/2026.
Commercial selection by EIC Controls
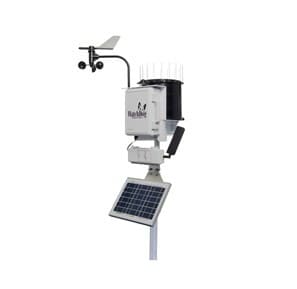
A series of your own on climate hazards means logging several variables at the same site, for years. The WatchDog 2900ET weather station logs air temperature, relative humidity, dew point, rainfall, wind speed and direction and solar radiation, and calculates reference evapotranspiration (ETo); its display shows daily highs and lows, and the measurement interval can be set from 1 to 60 minutes. Still to be sized: the location and exposure of the sensors, the interval in relation to memory (the datasheet gives 183 days of data at a 30-minute interval) and the communication route (wireless, cellular or direct connection).
Instruments for this application
Spectrum Technologies · 3350WD2
WatchDog 2900ET Weather Station
This powerful weather station measures, calculates, and logs evapotranspiration (ET), solar radiation, wind speed and direction, wind chill, dew point, temperature, relative humidity, and rainfall.
Keep reading
Changing site or instrument without breaking the record: lessons from the Montseny summit series (1950-2025)
On 31 October 2026 AEMET and the SMC published an analysis of the Montseny summit series, which joins two sites and fills the gaps from 2001 to 2010. What it teaches anyone planning to move a station or change a sensor.
Week in review, 19 to 23 October 2026: from the 9 km grid to your plot
The week's four pieces (water level, frost, the warmest September and dendrometers), three European signals with their sources (ECMWF's open 9 km data, AEMET's analysis of the Catalonia rainfall and drought according to the JRC) and what is coming: the end of summer time on the 25th and the MARS Bulletin on the 26th.
Week in review, 5 to 9 October 2026: what the thermometer does not see
The week's four pieces, three of them on what the thermometer does not measure, three European signals with their sources, and what is coming: the Environment Council on 12 October, the September summaries still to be published and the end of summer time on 25 October.