
Agriculture and soil · Installation and calibration
Frost in the field: at what height, under what shield and where to place the sensor so the alarm comes in time
The temperature that decides frost damage is that of the plant tissue, and it is hard to measure. Five decisions for measuring the air as close to it as possible: height, shield, points in the plot, the variable for your protection method, and threshold with alarm.
On a clear, still night, the number that decides whether the blossom is lost is not the one from the nearest weather station: it is the temperature of the bud, flower or small fruit you want to protect. That temperature is hard to measure, and FAO warns that it is likely to differ from air temperature. What you do decide, once and before the first frost, is at what height, under what shield and at which points the air is measured, and which variable triggers the alarm. This guide works through those five decisions using FAO guidance and two peer-reviewed papers, and ends with their limits.
1. At the height of what you protect
FAO notes that frost damage percentages are commonly based on the tissue spending half an hour below the critical temperature, whereas air temperature is measured in a standard shelter at 1.5 m. Perry (1994), cited by FAO, recommends placing thermometers at the lowest height where protection is wanted, and FAO adds that the general recommendation was to place them lower in short, dense crops and higher in taller, sparse ones. The idea, the text says, is for the sheltered air reading to be as close as possible to the temperature of the plant being protected.
Height matters because on frost nights the air is not the same temperature higher up as lower down. Before installing wind machines, FAO asks growers to check that the temperature inversion between 2 and 10 m is at least 1.5 °C on most frost nights. To find out how much the reading changes in your own plot, the most direct way is to put two probes at two heights during the first cold nights and compare them.
2. Shielded from the sky, knowing the plant runs colder
When discussing heaters, FAO says temperature should be measured in a Stevenson screen, a fruit-frost shelter or a Gill shield that prevents the thermometer from being exposed to the clear sky. That is what makes the reading air temperature, comparable between points and between nights (see our guide to radiation shields).
The FAO guide warns that the temperature of a leaf, bud or small fruit is likely to be lower than the shelter temperature, because exposed organs lose heat through long-wave radiation. A review on trees (Charrier and colleagues, 2015) reports that the temperature of the shoot apical meristem may deviate from air temperature by ±4 °C. Two practical consequences follow: the shielded reading is a reference, not tissue temperature, and the alarm threshold needs a margin. FAO also cites Perry's (1994) caution that the sensor should not be placed where protection methods affect it directly, for example radiation from heaters.
3. In the low spots, and at more than one point
Cold air is denser than warm air, flows downhill and collects in low spots, which according to FAO consistently have colder nights when the sky is clear and the wind is weak. FAO counts a network of temperature points throughout the crop among the essentials, not a single one.
Is the nearest station enough? A study with 18 automatic weather stations placed in the canopy of orchards in Vojvodina, a flat region of northern Serbia, collected data from 2013 to 2018 and compared them with climatological stations within 50 km, which measure at 2 m over grass inside a shelter (Firanj Sremac and colleagues, 2021). At the orchard paired with the Novi Sad station, the minimum was lower throughout the year than at that station and lower than the reanalysis. At a plum orchard, differences in maximum and minimum temperature from the Vršac station were 2.5 °C, and up to 5 °C in specific cases. The authors conclude that, in the case studied, reanalysis is not a reliable source of information on plants' exposure to low temperatures, and that the minimum from a nearby climatological station with similar characteristics can be used, but with awareness of the possible error. They also note that a cover crop can increase frost risk by lowering the minimum. The study comes from flat land; on sloping ground, the cold-air drainage FAO describes comes on top of that.
4. Which temperature to watch depends on how you protect
If you protect with sprinklers, the variable that matters is the wet-bulb temperature. For growers without waterlogging, water shortage or cost concerns, FAO advises starting sprinklers when the wet-bulb temperature approaches 0 °C or the critical temperature, depending on the value of the crop and concern about losses. Over-plant sprinklers should all be running when the wet-bulb temperature approaches the critical temperature, and they can be stopped after sunrise once it rises above it again.
FAO's wet-bulb worksheet works with the dew-point temperature, and the method compares its result with the air temperature measured upwind of the protected crop. To follow it you need to measure air humidity as well as temperature, and to have a measuring point outside the sprinkled area.
5. The threshold is a guideline, and the alarm has to warn in time
FAO warns that critical temperatures for orchards and vineyards change with the phenological stage, that they are often determined on cut branches in a cold chamber and that, in practice, they should only be used as a guideline. A table of critical temperatures gives you a starting threshold, not a figure to carry over unchanged from one crop, variety or stage to another.
Two configuration details follow. If damage is tied to half an hour below the critical temperature, a one-hour logging interval cannot tell you whether that half hour happened. And the alarm has to arrive in time to start protection before damage occurs: FAO counts it among the essentials and describes options ranging from alarms with the sensor in a shelter near the house to systems that phone you or transmit by radio from a remote station.
Checklist before the first frost
- Height: sensor at the lowest height you want to protect.
- Shield: no exposure to the sky, and out of the direct reach of heaters or other protection methods.
- Points: at least one in the lowest part of the plot and one reference point; the nearest station does not replace that network.
- Variable: if you protect with water, temperature and humidity, with a point upwind of the sprinkled area.
- Threshold and interval: a starting threshold for the crop and stage, with a margin, a logging interval shorter than 30 minutes and an alarm that warns you in time.
Limits
- This guide gives no critical temperatures: they depend on crop, variety and stage, and FAO presents them as guidelines.
- The Vojvodina study covers a flat region, with orchards and stations from one specific network, and its authors acknowledge missing data and sparse spatial coverage; the differences of 2.5 and 5 °C do not carry over to another plot.
- The ±4 °C for the meristem comes from a review, not from a measurement in your crop, and it is not a correction to apply to the shielded reading.
- What is said about low spots applies, according to FAO, to clear nights with weak wind.
References
- Snyder, R. L. and de Melo-Abreu, J. P. (2005). Frost Protection: Fundamentals, Practice, and Economics. Volume 1. FAO Environment and Natural Resources Series 10. Rome: FAO. Contents, chapter 2 and chapter 5. Accessed 19/10/2026.
- Firanj Sremac, A., Lalic, B., Cuxart, J. and Marcic, M. (2021). Maximum, Minimum, and Daily Air Temperature Range in Orchards: What Do Observations Reveal? Atmosphere, 12(10), 1279. DOI: 10.3390/atmos12101279. Full text. Accessed 19/10/2026.
- Charrier, G., Ngao, J., Saudreau, M. and Améglio, T. (2015). Effects of environmental factors and management practices on microclimate, winter physiology, and frost resistance in trees. Frontiers in Plant Science, 6. DOI: 10.3389/fpls.2015.00259. Full text. Accessed 19/10/2026.
Commercial selection by EIC Controls
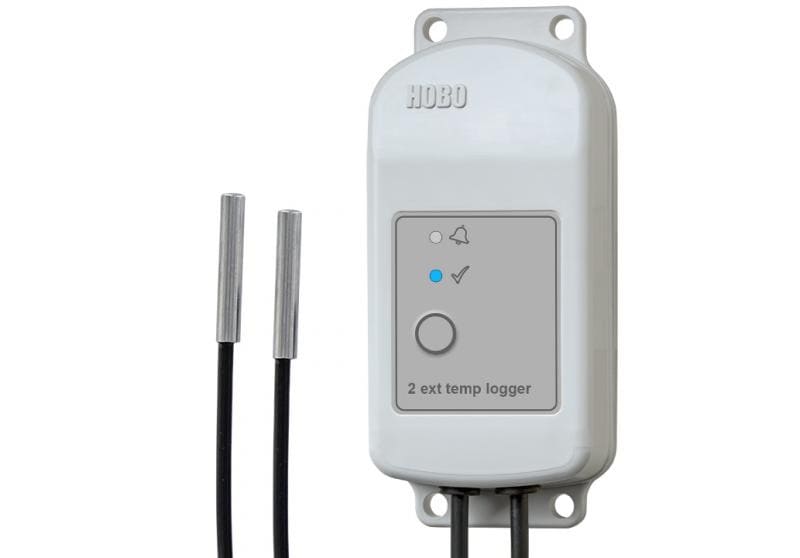
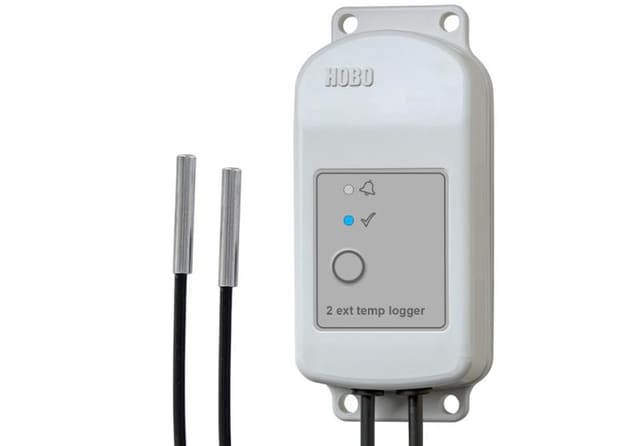
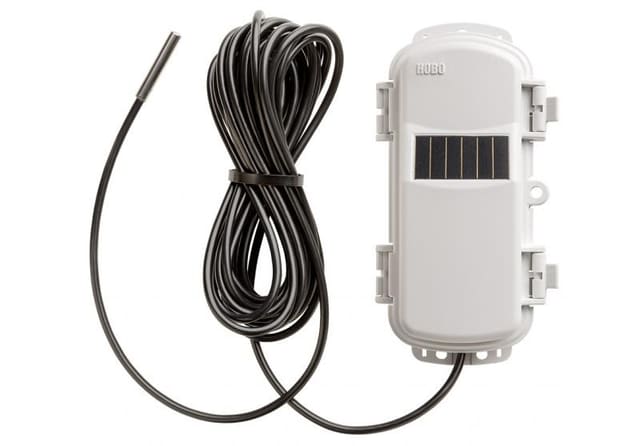
The HOBO MX2303 data logger has two external temperature sensors with 2 m cables on a single unit, so you can compare two heights or two nearby points during the first cold nights; its datasheet states an accuracy of ±0.25 °C from -40 to 0 °C, a logging interval of 1 s to 18 h, visual alarms on the logger itself and download over Bluetooth at about 30 m. To follow temperature remotely, the RXW-TMB-868 wireless temperature sensor, with a 5 m cable, sends its data to a central station on the same network, and the data can be viewed online. Still to be sized: the radiation shield for each probe, the measuring points in the plot, the central station and remote alerting and, if you protect with water, humidity measurement.
View datasheet for the MX2303 · View datasheet for the RXW-TMB-868 · Talk to a specialist
Instruments for this application
LI-COR (HOBO, InTemp, LI-COR) · MX2303
HOBO MX2303 Two External Temperature Sensors Data Logger
The HOBO MX2304 is a weatherproof data logger with one external temperature sensor. Leveraging Bluetooth Low Energy, the logger enables easy, fast set up and data download directly from your mobile device, and provides high-accuracy measurements in harsh…
LI-COR (HOBO, InTemp, LI-COR) · RXW-TMB-868
HOBOnet Temp Sensor (air, soil, and water)
The HOBOnet Wireless Temperature Sensor provides a cost-effective and scalable solution for web-enabled monitoring of air, soil, and water temperatures. HOBOnet Wireless Sensors communicate data directly to the RX3000 weather station or pass data through…
Keep reading
Field calibration or laboratory curve: what one study measured with soil moisture sensors
A study published in May 2026 calibrated low-cost capacitive sensors in the laboratory and then moved them to real plots. The laboratory curve drifted in the field, and a single reference measurement on site recovered much of the accuracy.
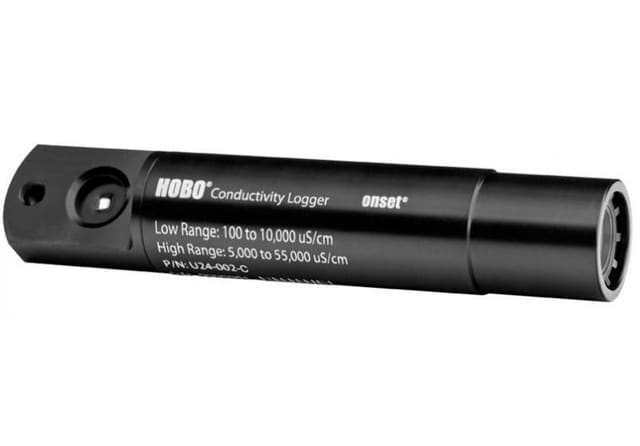
How long does biofouling take to spoil a conductivity record? What a study with moored sensors in the Baltic measured
In a study off the southern Baltic coast, a conductivity sensor moored at 2 m with a used TBT cell was out of specification at the first comparison after deployment, on day 32; with a UVC emitter, the last references, after 237 days, were within the margin. What this changes when planning visits and references.
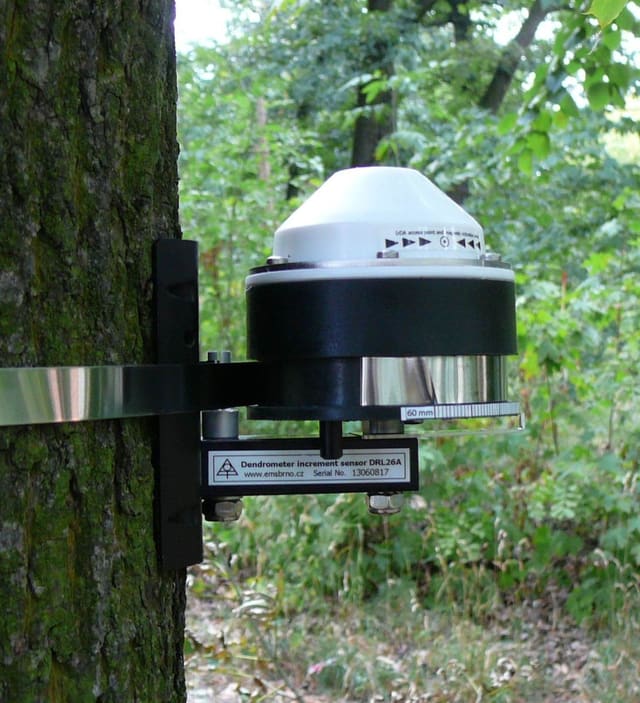
Measure the tree or the soil to decide when to irrigate? What a dendrometer study in a Swiss apple orchard found
A study in a Swiss apple orchard compared dendrometer-driven irrigation with irrigation driven by soil moisture sensors over two seasons: the dendrometer treatment used 38% less water in 2022 and more than 45% less in 2023, with no significant difference in yield. What it allows us to conclude, what it does not, and what it changes in deciding what to measure.