
Weather monitoring · Temperature and humidity
Record heat stress in summer 2026: what your station's thermometer does not measure
On 2 October 2026 Copernicus published its review of the European summer: western Europe averaged a record 41 days of at least ‘strong’ heat stress. The index behind it combines four variables, and a station that logs only air temperature provides one of them.
On 2 October 2026 the Copernicus Climate Change Service (C3S), implemented by the European Centre for Medium-Range Weather Forecasts (ECMWF), published its review of the European summer of 2026 together with a press release summarising its findings. That the summer set a temperature record in western Europe was already known, and we discussed it in September. What is new is heat stress, and for anyone who measures it has a practical consequence: the index Copernicus uses needs four variables, and a station that logs only air temperature provides one of them.
What Copernicus published
According to the C3S press release and review:
- Averaged across western Europe, there were 41 days with at least ‘strong’ heat stress, a record and five more than in 2003.
- In the same region, days with ‘very strong’ heat stress reached 13, also a record.
- By the end of the season, 52 % of the continent had been exposed to at least ‘very strong’ conditions, that is, feels-like temperatures of 38 °C or more.
- Parts of Italy and southern Spain saw at least ‘strong’ heat stress on almost every day of the summer.
The thresholds are those of the Universal Thermal Climate Index (UTCI): 32 °C for ‘strong’ and 38 °C for ‘very strong’ heat stress. The heat stress data come from the C3S ERA5-HEAT dataset, and climate comparisons use the 1991 to 2020 reference period. Source: Copernicus Climate Change Service / ECMWF.
A feels-like temperature is not an air temperature
The review describes the UTCI as an index that considers temperature, humidity, wind speed, sunshine and the heat emitted by the surroundings. The paper documenting the ERA5-HEAT dataset (Di Napoli and colleagues, 2021) defines it as the air temperature of a reference condition that would cause the same physiological model response in the human body as the real condition, and lists the four variables required to compute it: 2 m air temperature, 2 m dew point temperature (or relative humidity), wind speed at 10 m above ground and mean radiant temperature.
By construction the index depends on all four at once: with the same air temperature, a different humidity, wind or radiation gives a different result. Mean radiant temperature is computed from direct, diffuse and surface-reflected solar radiation, and from the thermal radiation coming down from the atmosphere and up from the ground. The authors describe it as a major component of thermal comfort.
Here is the paradox for anyone with a well-installed station: its thermometer sits inside a radiation shield precisely so that the sun does not heat the sensor. That is the right measurement for air temperature and, by design, it leaves out the radiative term that the UTCI adds back in.
What to measure at your own point if you want to talk about heat stress
- Air temperature and humidity, in the shade of the shield and at a recorded height. These are two of the four variables, and ERA5-HEAT takes them at 2 m.
- Wind, with its height written into the metadata. The index uses wind at 10 m above ground. An anemometer on a 2 or 3 m tripod measures at a different height; it is not the same data point and should not be compared as if it were.
- Radiation, if the station does not already measure it. A solar radiation sensor at the same point makes it possible to estimate the solar part of mean radiant temperature; the thermal part (from the sky and the ground) requires another measurement or an estimate, and that choice should be documented.
- A logging interval of one hour or less. ERA5-HEAT maps are hourly; a finer series can always be aggregated to the hour, while a coarser one cannot be broken down.
- The surroundings, described. Surface type (asphalt, grass, bare soil), nearby walls, shade and the height of each sensor. According to the ERA5-HEAT authors, the difference between reanalysis and measurements grows with grid cell size, with complex terrain and with changes in surface roughness and type.
What these data do not yet tell you
- How many days there were at your point. The 41 days are an average across western Europe. The review itself notes that within that area some places had no day of ‘strong’ or ‘very strong’ heat stress, while others had up to a full season of ‘strong’ heat stress and up to 75 days of ‘very strong’.
- How far the grid cell is from your sensor. ERA5-HEAT is a 0.25° by 0.25° grid, and its authors point out that even the smallest reanalysis grid cell is an average over an area, whereas a station measures at one specific point, which introduces a representativeness error. The sources consulted contain no comparison of the 2026 values with station measurements in Spain or Portugal.
- What happened after August. The summer figures cover June to August 2026; September is outside them.
This article does not interpret occupational or health regulations: the categories cited are those of the UTCI index used by C3S.
References
- Copernicus Climate Change Service (C3S) / ECMWF (2026). Copernicus: Record heat stress and low river flows marked Europe's 2026 summer. Press release, 2 October 2026. Accessed 7 October 2026 at 06:45 (Madrid time).
- Copernicus Climate Change Service (C3S) / ECMWF (2026). European summer 2026: records, extremes and context, with the full report in PDF. Published 2 October 2026. Accessed 7 October 2026 at 06:45 (Madrid time).
- Di Napoli, C., Barnard, C., Prudhomme, C., Cloke, H. L. and Pappenberger, F. (2021). ERA5-HEAT: A global gridded historical dataset of human thermal comfort indices from climate reanalysis. Geoscience Data Journal, 8(1), 2-10. DOI: 10.1002/gdj3.102.
Commercial selection by EIC Controls
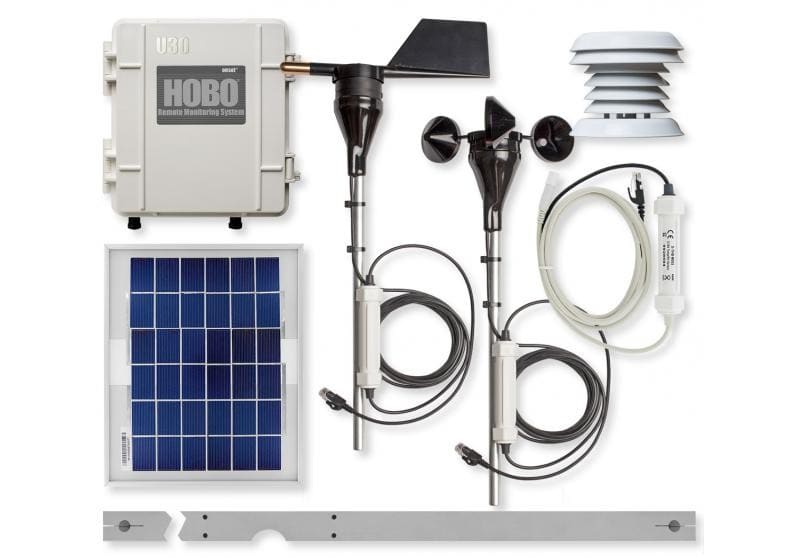
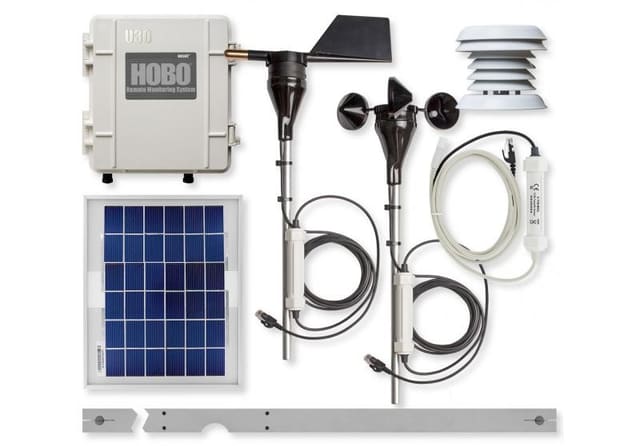
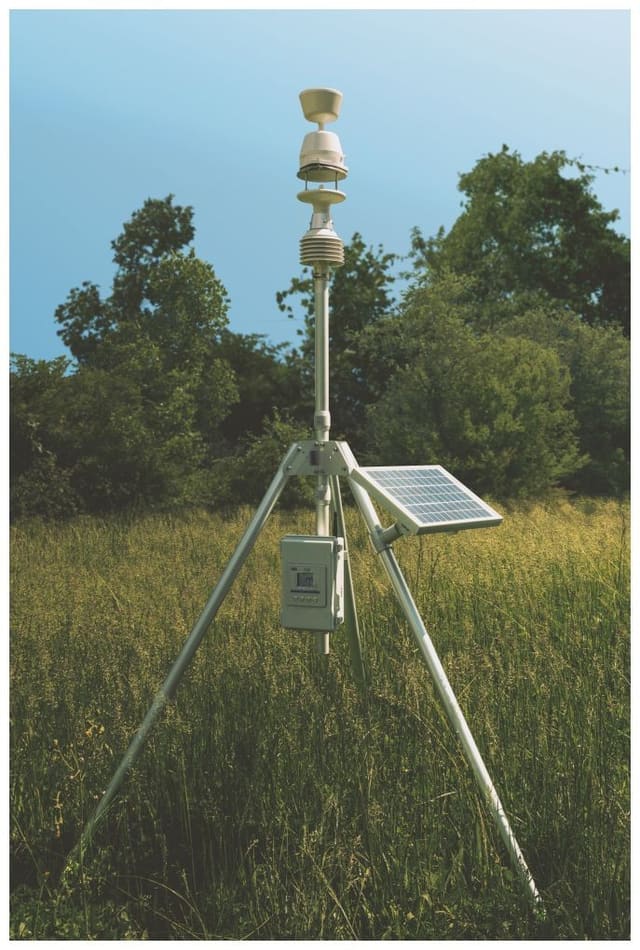
The HOBO U30 USB Weather Station Starter Kit measures temperature and relative humidity, with the sensor inside an included solar radiation shield, plus wind speed and direction: three of the four variables that go into the UTCI, with wind at tripod height. Radiation is not part of the kit, and the measurement point, the tripod (2 or 3 m, chosen separately according to the datasheet) and the software, which is ordered separately, still need to be specified.
Instruments for this application
LI-COR (HOBO, InTemp, LI-COR) · U30-NRC-SYS-C
HOBO U30 USB Weather Station Starter Kit
The HOBO Weather Station Starter Kit combines our most rugged data logging weather station with out-of-the-box convenience. The U30/NRC accepts up to 10 plug-and-play Smart Sensors. Just plug in your sensor and it’s automatically recognized – no programming,…
Keep reading
Mainland Spain's warmest September since 1961 was a month of maxima: what to check in your series before comparing it with AEMET
AEMET reported on 16 October 2026 that September was the warmest in mainland Spain since 1961; according to the accompanying advance summary, average maxima were 4.6 °C above normal and average minima 2.1 °C above. What to check in your own series before comparing it with official figures that are still provisional.
Week in review, 12 to 16 October 2026: humidity, from the air to the leaf
The week's two pieces, linked by relative humidity (from the dew point to leaf wetness), three European signals with their sources, and what is coming: the European climate resilience framework expected on 20 October and the end of summer time on the 25th.
Sentinel-3C is in orbit: what a satellite measures and what your station still measures
On 15 September 2026 the European Union launched Copernicus Sentinel-3C. What it observes from 800 km, why land surface temperature is not air temperature, and what to log at your own point.