
Data logging · Weather monitoring
Week in review, 14 to 18 September 2026: your own point, the satellite and the laboratory curve
Three articles on what makes a number measured at one point trustworthy, three European signals from the week with their sources, and what is due in the coming days.
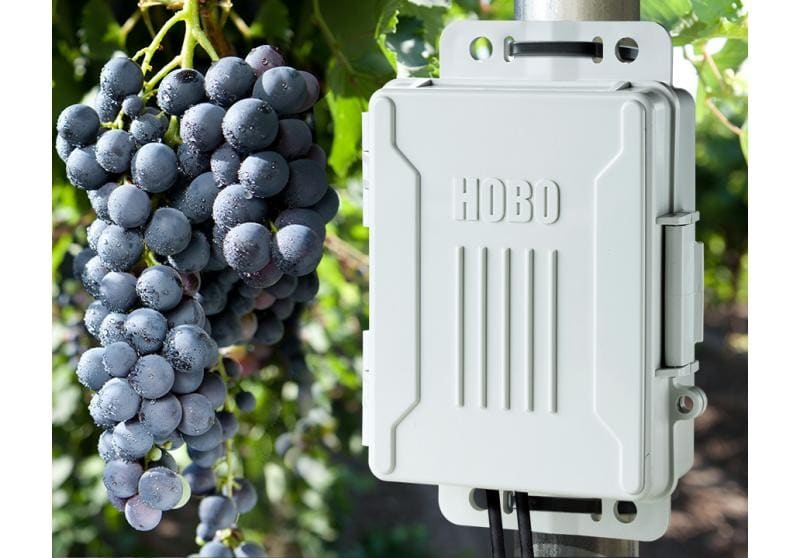
Three articles this week and, underneath all three, the same question: what is a number measured at one particular point worth, and what does it take to make it worth something?
What we published this week
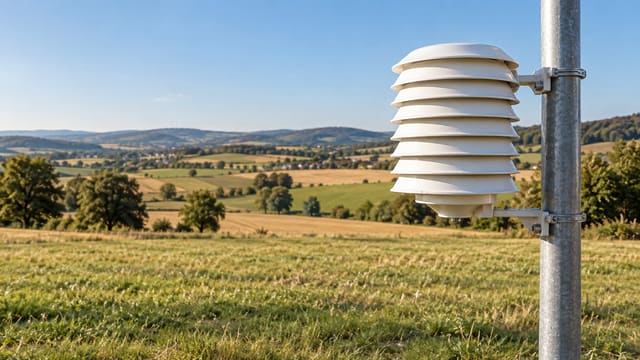
Why two identical sensors do not read the same: choosing a radiation shield: the shield around the sensor can contribute more error than the sensor itself, and choosing between natural ventilation and forced aspiration changes the whole series.
Sentinel-3C is in orbit: what a satellite measures and what your station still measures: the satellite observes land surface temperature, which is not air temperature, so it does not replace the record taken at your own point.
Field calibration or laboratory curve: what one study measured with soil moisture sensors: in that study the laboratory curve drifted once the sensors reached real plots, and a single reference measurement on site recovered much of the accuracy.
Three signals from Europe
The Antarctic ozone hole grew above average. On 16 September 2026 Copernicus published, with data from the Atmosphere Monitoring Service (CAMS), its tracking of the second half of the year: on 12 September the hole reached roughly 25 million km², about 5 million km² above the average for this time of year, and by the end of August its area was already larger than Antarctica. Source: Copernicus, CAMS. Why it matters: stratospheric ozone modulates the ultraviolet radiation that reaches the ground, so anyone measuring radiation, or leaving sensors and cabling exposed to the weather, is working with that background variable.
Spain closed the summer with 61 days under heatwave conditions. On 9 September 2026 AEMET reported that the summer of 2026, meaning June, July and August, added up to 61 heatwave days across mainland Spain and the Balearic Islands, more than any other recorded summer, against 41 days in the summer of 2022 and 36 in the summer of 2025. Already in the meteorological autumn a further heatwave was recorded which, provisionally, ran from 2 to 7 September and affected 16 provinces. Source: AEMET. Why it matters: a series with that many extreme days tests both the sensor's shield and the working range of the equipment, which are precisely the conditions in which the choice of radiation shield decides the error.
The 2026 fire season is running below 2025 and well above the average. EFFIS data compiled by the Joint Research Centre give 658,327 ha burnt in Europe from the start of the year to 10 September 2026, with the page updated on 11 September: below the 1,003,860 ha recorded by the same date in 2025, the worst year on record, and above the twenty-year average for 2006 to 2025 of 338,163 ha. Source: EFFIS, Joint Research Centre. Why it matters: after a fire the cover and the soil around a measurement point change, and it is worth documenting what changed before comparing with the earlier series.
The week ahead
The Combined Drought Indicator from the European Drought Observatory is updated every 10 days, so a new map is due in the coming days. CAMS notes that the ozone hole usually reaches its maximum between mid-September and early October, which puts next week squarely inside that window. And the EFFIS burnt-area figures keep being updated, so the running total of 658,327 ha will fall short.
Commercial selection by EIC Controls
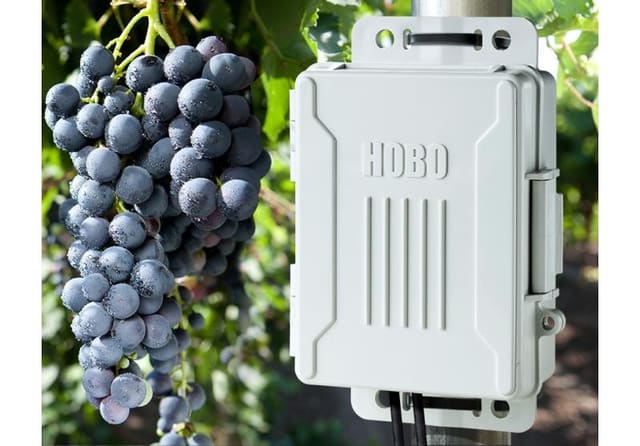
The HOBO USB micro station data logger records several of this week's quantities at a single point: temperature, relative humidity and soil moisture, as well as rainfall, wind and light, with five smart sensor inputs and direct USB offload. It is relevant here because the value of a series depends on the point and the installation, not on the map. Still to be sized: the specific sensors, the shield for the air probe, the mounting height and the logging interval.
View the datasheet · Talk to a specialist
References
- Copernicus, EU Space (2026). "Tracking the Antarctic ozone hole in the second half of 2026". eu-space.europa.eu. Accessed 18/09/2026.
- AEMET (2026). "España registra 61 días bajo ola de calor en 2026, más que en ningún otro año". aemet.es. Accessed 18/09/2026.
- Joint Research Centre, EFFIS (2026). "Current wildfire situation in Europe". joint-research-centre.ec.europa.eu. Accessed 18/09/2026.
- Copernicus Emergency Management Service (2026). "EDO Combined Drought Indicator (CDI), factsheet v4". drought.emergency.copernicus.eu. Accessed 18/09/2026.
Instruments for this application
LI-COR (HOBO, InTemp, LI-COR) · H21-USB
HOBO USB Micro Station Data Logger
Rugged and compact, the redesigned HOBO USB Micro Station is a weatherproof data logger for multi-channel monitoring of microclimates. Starting at just EUR 202,22 this battery-powered station accepts up to five plug-and-play Smart Sensors and has a hinged…
Keep reading
Sentinel-3C is in orbit: what a satellite measures and what your station still measures
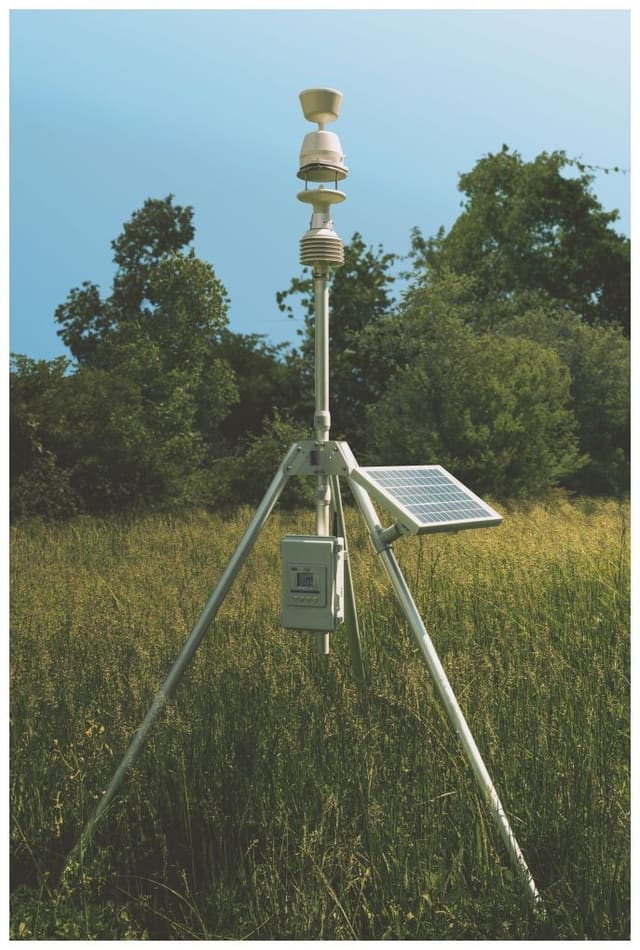
On 15 September 2026 the European Union launched Copernicus Sentinel-3C. What it observes from 800 km, why land surface temperature is not air temperature, and what to log at your own point.
Why two identical sensors do not read the same: choosing a radiation shield
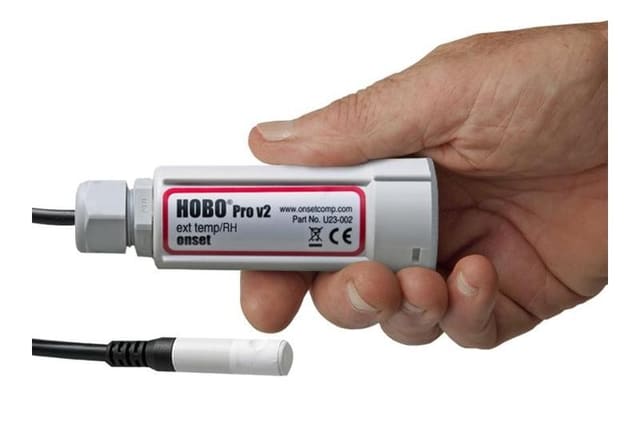
The shield around the sensor can contribute more error than the sensor itself. What two peer-reviewed studies say about natural ventilation and forced aspiration, and what to document so the series is usable.
Summer 2026 was western Europe's warmest on record: what changes at your measurement point
Copernicus issued its August assessment statement on 10 September 2026: a record summer in western Europe, with anomalies referenced to 1991 to 2020. What those figures say, and do not say, about a series of your own.